Central Bank Decisions: How They Affect Your Trades
How central bank decisions move forex, gold and indices in 2026 — the expectation gap, a minute-by-minute FOMC playbook, kumo twist filters and sizing rules.
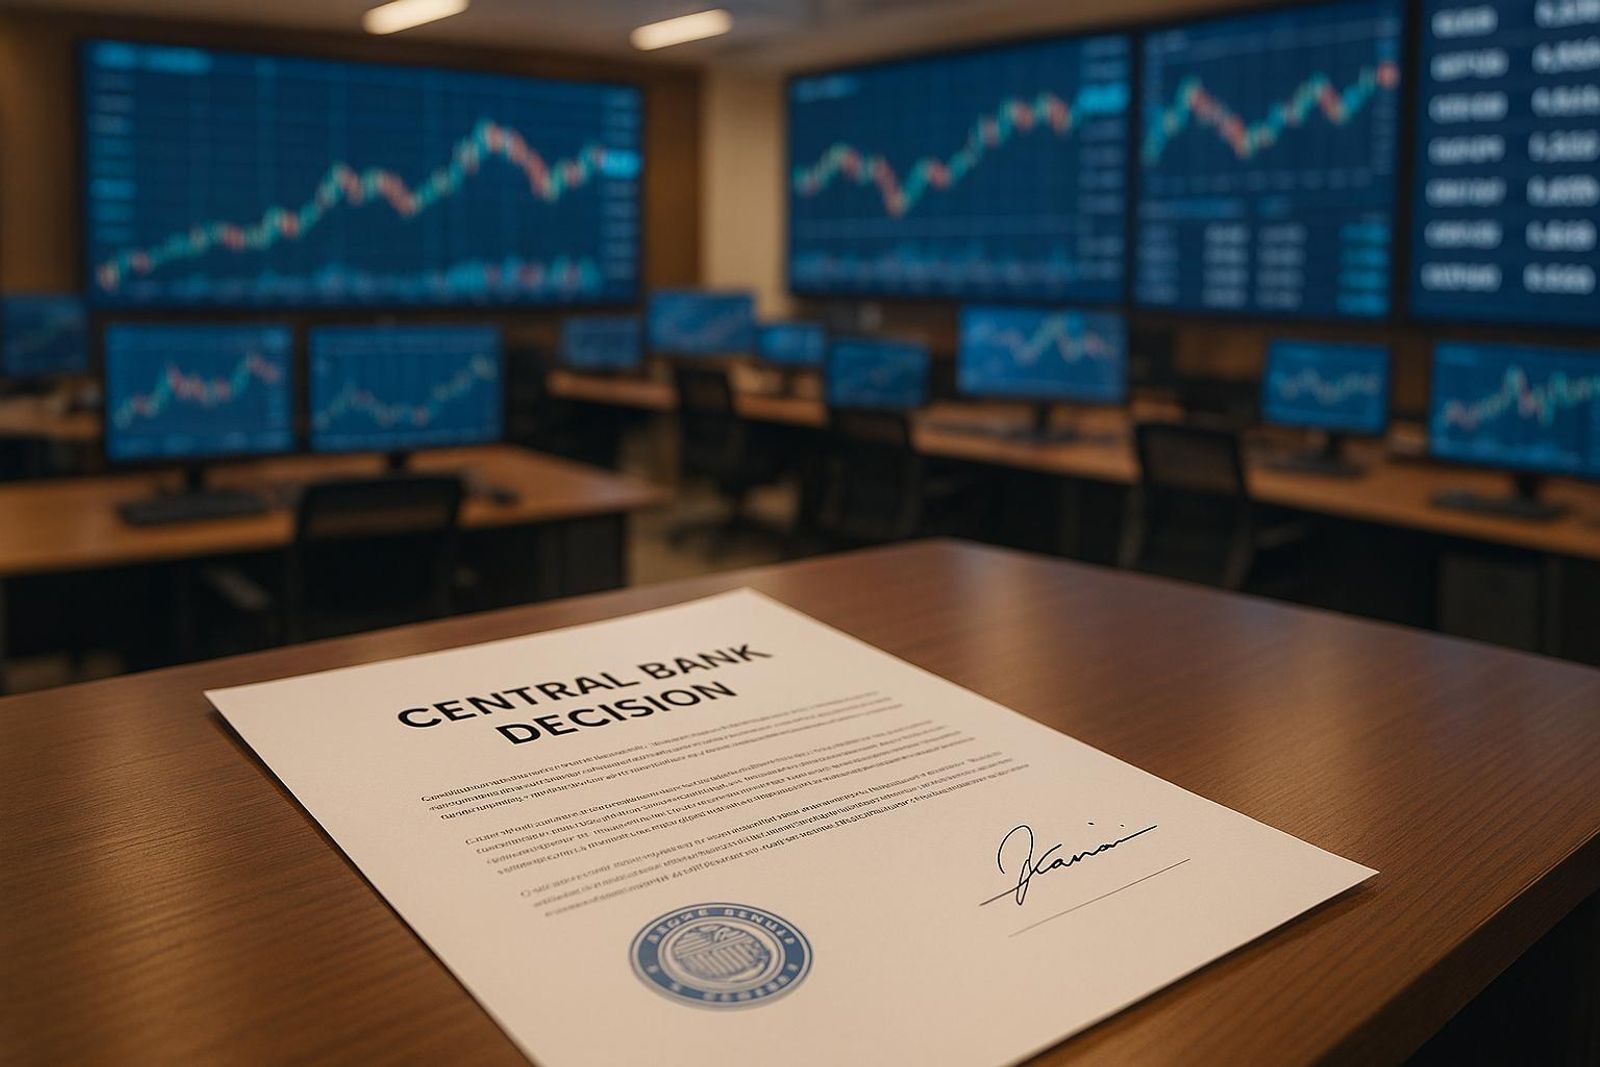
By Marcel Hambálek · Senior Trader, For Traders
Central bank decisions move markets through the gap between what was priced in and what was delivered — not through the headline rate itself. A trader's edge on decision day comes from three inputs: the rate versus expectation, the wording delta in the statement, and the tone of the press conference, all sized so a single candle can't end an evaluation.
Key takeaways
- Price reacts to the surprise, not the number — if a 25bp cut was 95% priced by OIS and CME FedWatch, the cut itself is a non-event and the statement wording becomes the trade.
- The first two minutes belong to algorithms; the tradable leg for most discretionary traders is the second move, usually after the press conference starts.
- A leading-indicator checklist (futures-implied path, 2-year yield, core PCE trend, wage growth, claims, regional Fed surveys) anticipates policy shifts weeks before the meeting.
- An Ichimoku kumo twist that forms inside 24 hours of a decision is a low-quality signal — the cloud is projected from pre-repricing data and gets overwritten by the new curve.
- Gold reacts twice to a single decision: once to the headline via the dollar, again to real yields once the curve settles — which is why XAUUSD traps traders who only trade the first candle.
- Policy divergence between the Fed, ECB and BoJ produces multi-week trends in EURUSD, USDJPY and DXY, while the decision candle itself is often noise.
Watch: related video
What actually moves price when a central bank decisions actually land
Central bank decisions move currencies through the gap between what the market already priced and what actually gets delivered — not through the headline rate itself. That gap gets transmitted through short-term rate expectations and interest rate differentials, which is why a "surprise" hike can send a pair lower and a "disappointing" hold can send it higher.
If a 25bp hike is 100% priced into OIS (overnight index swaps — the market's implied path for the policy rate) going into the decision, the hike itself is old news. Everyone already owns that outcome. The statement, not the rate, carries the move — because the statement is where new information about the next move actually lives.
The expectation gap: why the priced-in rate matters more than the rate
OIS pricing is the market's real-time bet on where the policy rate lands at every future meeting. Before an FOMC statement or ECB decision, check whether the move is fully priced, partially priced, or a coin-flip. A fully-priced outcome produces a muted first candle almost every time — the "surprise" was already spent. A partially-priced outcome is where you get the violent leg, because positioning has to unwind fast. This is the single most common mistake we see in evaluation accounts: traders react to the rate number in isolation and get run over because the market had already discounted it three weeks earlier.
The wording delta: reading the statement as a redline
Forward guidance is the central bank's language about the likely future path of policy — it's the mechanism that moves expectations without moving the rate itself. Read the new statement against the previous one like a lawyer reads a contract redline: what word got added, what word got dropped, did "patient" become "data-dependent," did "transitory" disappear. The terminal rate — the market's estimate of where hikes or cuts ultimately stop — often shifts more from a single adjective than from the decision itself. This is input two in the hierarchy, and it's usually bigger than input one.
The press conference: where the second leg is born
The statement is scripted; the press conference is not. Tone, hesitation, and off-script answers to reporters give the market a second, less-controlled data point on the terminal rate — and this is where the largest single-session ranges tend to build. You'll often see the initial statement candle get fully retraced or extended once the chair starts speaking. Rank your risk sizing accordingly: rate vs. expectation first, wording delta second, press conference tone third — and the third input frequently produces the biggest candle of the day.
Mechanically it's simple: rate expectations move the front end of the yield curve, the front end sets the FX carry on a pair, and carry repricing is what actually moves the exchange rate. Every step in this guide comes back to that chain.
Policy action to market reaction: the cross-asset map
Same decision, four different transmission belts: FX trades the rate differential, indices trade the discount rate on future cash flows plus liquidity, gold trades real yields and the dollar, and bonds trade the expected path — not the print itself. If you only watch one asset on decision day, you're missing the read-through that the other three give you for free.
Currencies, indices, gold and bonds — how each transmits the same decision
How do central bank decisions affect the forex market specifically? Through the carry channel — a hawkish surprise widens the expected rate gap against other currencies, capital chases the higher yield, and the pair (or DXY basket) bids. Indices don't care about carry; they care about the discount rate applied to future earnings and about liquidity conditions, so a hawkish hold can still see US100 sell off even without a hike, simply because guidance pushed cuts further out. Gold ignores the nominal rate and trades real yields (nominal minus inflation expectations) alongside the dollar — a hawkish surprise that also lifts real yields is gold's worst combination. Bonds, particularly the 2-year yield, are the purest expression of the expected path since they price the average policy rate over the next two years more than the current one.
| Scenario | DXY | EURUSD | USDJPY | US100 | XAUUSD | 2-year yield |
|---|---|---|---|---|---|---|
| Hawkish surprise (rate/tone above priced-in) | Up | Down | Up | Down | Down | Up sharply |
| Dovish surprise (rate/tone below priced-in) | Down | Up | Down | Up | Up | Down sharply |
| Hold + hawkish guidance | Up (grind) | Down (grind) | Up (grind) | Flat/down | Down (mild) | Up (mild) |
| Hold + dovish guidance | Down (grind) | Up (grind) | Down (grind) | Up | Up (mild) | Down (mild) |
Treat that table as tendencies, not rules — it describes the modal reaction, not every reaction. Positioning going into the event, the size of the surprise, and what's happening on other desks that same week can all override the textbook move.
QE and QT in 2026: the liquidity layer under the rate decision
Quantitative easing is the central bank buying assets to add reserves and push liquidity into the system beyond what the policy rate alone would deliver. Quantitative tightening is the reverse — letting the balance sheet run off (or actively selling) to drain reserves out of the system. In 2026 terms, balance-sheet runoff means the central bank isn't reinvesting maturing bonds at the same pace, so liquidity leaves the system quietly, month after month, independent of what happens at the rate decision itself. The quantitative tightening effect on markets is why you can get a dovish rate print and still see index rallies fade within days — the rate cut is a headline, but a shrinking balance sheet is a persistent drag on the same liquidity that fuels multiples. Traders who only watch the rate miss this layer entirely.
Sector rotation inside US100 when the curve reprices
US100 rate sensitivity isn't uniform across the index — long-duration tech names (high growth, cash flows priced far into the future) get hit hardest by a hawkish repricing because their valuation leans on a discount rate that just moved against them. Defensives and cash-generative names inside the same index absorb the shock better. When the curve flattens or inverts further on hawkish guidance, you'll typically see rotation out of the highest-multiple names first — that's sector rotation playing out in real time, and it's tradeable independent of the index-level direction.
One honest caveat across all of this: correlations break during stress events. When a genuine risk-off shock hits — a bank failure, a geopolitical shock, a liquidity crunch — gold, bonds, and FX correlations to rate differentials can all collapse simultaneously, because everything trades the dollar and nothing trades its usual driver. Don't lean on the map above during those windows; size down and wait for correlations to normalize.
Anticipating a policy shift before the meeting
The indicators that anticipate central bank policy shifts fall into two buckets: market-priced (futures curves, the 2-year yield, OIS forwards) and data-driven (core PCE trend, Non-Farm Payrolls, regional Fed surveys). If you're only reading the statement on decision day, you're already three weeks late — the real signal builds in the data releases and yield moves that precede it.
The leading-indicator checklist and what each one signals
Run through this list before every FOMC, ECB, or BoE meeting. None of these predicts the decision alone, but a cluster moving the same direction usually front-runs the statement by two to six weeks.
| Indicator | What it measures | What a shift signals | Where to find it | Typical lead time |
|---|---|---|---|---|
| Fed funds futures curve | Market-implied path of rates | Repricing of cuts/hikes ahead of consensus | CME FedWatch | 1–8 weeks |
| 2-year Treasury yield | Near-term rate expectations | Front-runs almost every genuine pivot | Treasury/Bloomberg | 2–6 weeks |
| OIS forwards | Overnight rate expectations | Confirms or fades futures pricing | Broker/data terminal | 1–4 weeks |
| Core PCE (MoM/YoY) | Fed's preferred inflation gauge | Trend toward or away from 2% target | BEA release, monthly | 3–4 weeks |
| CPI | Headline/core consumer inflation | Sets market tone before PCE confirms | BLS release, monthly | 2–3 weeks |
| Non-Farm Payrolls | Labour market strength | Cooling vs re-acceleration of hiring | BLS, first Friday monthly | 4–6 weeks |
| Average hourly earnings | Wage growth pressure | Sticky wages = sticky inflation risk | BLS, with NFP | 4–6 weeks |
| Initial jobless claims | Weekly layoffs | Earliest crack in labour data | DOL, weekly | 1–2 weeks |
| Regional Fed surveys | Business conditions (Philly Fed, Empire State) | Forward-looking business sentiment | Regional Fed banks, monthly | 3–5 weeks |
| ISM prices paid | Input cost pressure | Leading edge of inflation re-acceleration | ISM, monthly | 2–4 weeks |
Key factors shaping Federal Reserve rate decisions in 2026
Four threads dominate the reaction function this year: the inflation glide path versus the 2% target (still uneven, not a straight line down), whether the labour market keeps cooling or shows signs of re-tightening, balance-sheet runoff policy sitting quietly alongside the rate decision, and political/fiscal pressure that keeps leaking into every press conference question. Watch how the Fed frames the third one — quantitative tightening pace changes are policy too, even without a headline rate move.
Dot plot drift: reading the Summary of Economic Projections
The Summary of Economic Projections is the Fed's quarterly release showing each member's anonymous rate forecast — the dot plot. Any single dot means little; the median's quarter-on-quarter drift is often a cleaner signal of where policy is heading than a single hawkish sentence. If the median dot for year-end migrates lower two SEPs in a row, that's a trend, not noise — trade the drift, not the headline.
How bank research desks turn a decision into client guidance
Sell-side rates and FX desks translate a central bank decision into client guidance in three moves: redline the statement, reprice the terminal rate, republish a trade idea with an invalidation level — and they do it in 60-90 minutes. That speed isn't magic. It's a repeatable process, and you can copy the shape of it with free tools long before your broker's post-FOMC commentary even lands in your inbox.
The sell-side workflow: redline, reprice, republish
Here's how banks translate rate decisions into client guidance, stripped of the jargon. A junior strategist pulls the new statement the second it hits the wire and runs it against the prior one in a Word redline — literally track-changes, word by word. Every addition, deletion and softened phrase gets flagged: "somewhat elevated" becoming "elevated," a dropped reference to "additional policy firming," a new nod to "balanced risks." Each flag gets mapped to a directional call — hawkish, dovish, or neutral-with-a-catch.
Next, the desk's rates strategist checks the change against the futures-implied path. If the redline reads hawkish but Fed funds futures haven't moved, that's often a fade signal — the market already priced it. If the implied path shifts more than 10bp on the release, that's confirmation the wording genuinely surprised positioning. Only then does the desk revise its terminal-rate call and FX forecast, and publish — usually a one-page note with a directional trade, an entry zone, and a stated level that invalidates the idea.
A retail-scale version you can run in 20 minutes
- Save the prior statement as plain text before the release — copy it from the central bank's own site, not a summary.
- The moment the new statement drops, paste both into a free diff tool (Google Docs' "Compare documents" or an online text-diff) and let it highlight every change automatically.
- Read only the changed lines. Classify each as added, deleted or softened, and note the direction it points — tighter, looser, or unchanged bias.
- Check CME FedWatch rate probabilities immediately after: did the implied path move more than 10bp? If yes, the redline matters. If no, the market front-ran it and you're trading a stale headline.
- Compare your read against your pre-written scenarios (see below) and only then decide whether your original level still holds.
This is trading the FOMC statement the way a desk does it — mechanically, not emotionally, with the diff doing the reading for you.
Your 2026 data stack: FedWatch, SEP, calendars and live commentary
Build a small, boring toolkit and use it every decision day, not just the big ones:
- CME FedWatch — real-time probabilities of the next Fed move, built from fed funds futures pricing; your fastest gauge of whether a hawkish redline actually shifted expectations.
- The Fed's Summary of Economic Projections and dot plot — quarterly, gives you the median committee view versus a single official's outlier comment.
- ECB and BoE press conference livestreams — tone and Q&A phrasing often move EUR and GBP pairs more than the rate line itself.
- A central bank calendar 2026 — mark every FOMC, ECB and BoE date months ahead so a decision never ambushes an open position.
The discipline that separates a desk note from a retail guess: write your two scenarios and your invalidation levels before the release, not after. Real-time analysis and forecasts on central bank rate decisions are only useful if you've already decided what you'll do with them — reading the redline after you've entered a trade is just narrating your own drawdown.
The decision-day playbook: T-24h to the next open
The move that busts your account rarely happens because you traded the wrong direction — it happens because you traded the wrong moment. Here's the timeline, minute by minute, the way a prop desk would run it.
T-24h to T-30min: pre-positioning, spreads and the pre-print drift
Flatten or halve exposure 24 hours out, and mark your invalidation levels before the noise starts. Twenty-four hours ahead of an FOMC statement, ECB rate decision, or BoE print, you'll typically see a directional drift as positioning unwinds — desks square books, options hedges get rolled, and volume thins on both sides of the book. This isn't signal, it's plumbing. Trading this drift as if it's conviction is how discretionary traders get chopped up before the real event even starts.
At T-30min, spreads on XAUUSD and EURUSD start widening — often 2-3x normal on the majors, more on gold — as market makers pull size ahead of the print. Book depth thins noticeably; the tight two-pip spread you're used to on EURUSD can blow out to 5-8 pips in the run-up. If you're still holding a position sized for a normal session, this is your last clean exit before the algorithms take over.
T+0 to T+2min: algorithms, slippage and why the first candle lies
The headline hits and machines trade the surprise — the delta between consensus and actual — in single-digit milliseconds, long before a human reads the second line of the statement. This is where slippage stops being theoretical. Stop orders resting through the print don't fill at your stop price; they fill at the next available price, and in the first 90 seconds that can be 20-40 pips away on majors, more on gold during a hawkish surprise. A stop-loss on gold through an FOMC print is not a guarantee of your max risk — it's a market order queued behind everyone else's.
By T+2min, the first move is often partially retraced as the initial algo reaction overshoots and slower money — the funds actually reading the statement — starts fading the spike. This is the candle that gets screenshotted and misread as "the move." It usually isn't the move.
T+15min to T+1 day: the press conference leg and the overnight follow-through
The press conference is where the durable leg usually forms — not the headline. Powell's tone on inflation risk, or Lagarde's framing of "data-dependent," repriced through Q&A carries more weight than the statement's wording delta itself. This second leg is typically the one that holds into the next session, because it reflects the market digesting guidance rather than reacting to a number.
By T+1 day, you're trading the repriced curve, not the headline — rate expectations across the futures curve have already absorbed the surprise, and price action reflects that new baseline.
| Tactical choice | What you're betting on | Fits a fixed daily loss limit? |
|---|---|---|
| Trade the release (T+0) | Your read on the surprise beats the algos | Rarely — slippage risk too high |
| Fade the first move (T+2min) | Overshoot reverts before press conference | Only with reduced size, tight invalidation |
| Wait for the second leg (T+15min+) | Press conference tone confirms direction | Best fit — spread normalized, ATR still elevated |
Expect ATR to expand 2-3x a normal session on decision day across XAUUSD and US indices — size for that expansion, not for yesterday's range, and the fixed daily loss limit stops being a wall you hit by accident.
Ready to trade funded capital?
Choose your path — Instant Accounts, One-Step or Two-Step Challenges — from just $23, with up to $300,000 in funded capital.
Choose your challengeThe Ichimoku kumo twist through a central bank announcement
A kumo twist is the point where Senkou Span A crosses Senkou Span B, projecting a colour change in the cloud 26 periods ahead — it's a signal about the medium-term equilibrium, not a trade trigger. Run that twist into an FOMC print or an ECB decision and you're reading a picture painted with pre-announcement price. The instant the rate lands differently than priced in, that picture can go stale.
What a kumo twist actually signals — and what it doesn't
Ichimoku Kinko Hyo builds the cloud from two forward-projected averages: Senkou Span A (the midpoint of Tenkan and Kijun, shifted forward) and Senkou Span B (the midpoint of the 52-period high/low, also shifted forward). When A crosses B, the cloud ahead flips colour — bullish kumo to bearish, or the reverse. That's the twist. It tells you the balance of recent price action is shifting, nothing more. It doesn't tell you momentum is there today, and it doesn't confirm direction on its own — that's what Chikou Span and price-versus-cloud position are for. Traders who buy a twist in isolation, without checking the Chikou Span is clear of price and clear of the cloud, are trading a lagging construct as if it were a live signal.
Why a policy repricing can validate or invalidate a twist
A twist forming into a scheduled decision is built entirely on pre-event candles. Two outcomes follow the announcement:
- Confirmation — the decision lands in the direction the twist was already leaning (say, a dovish cut confirming a bullish twist on gold). The twist becomes a high-quality continuation signal, and a kumo breakout in the following sessions tends to hold.
- Invalidation — a surprise in the opposite direction (a hawkish hold when cuts were priced) slams price the other way. The twist that looked clean 24 hours earlier gets flattened within days as new candles drag Span A back across Span B. You're left holding a false signal that the chart itself will quietly erase.
This is the same gap discussed earlier in this guide — expectation versus delivery — just expressed through a lagging indicator instead of a candle.
A filter rule for twists forming within 24 hours of a decision
- Don't act on a twist scheduled to complete within 24 hours of a known decision (FOMC, ECB, BoE, RBA calendar dates). The projection isn't wrong, it's just unconfirmed by information the market doesn't have yet.
- Wait for the first full close after the press conference — not the decision candle itself, the one after tone has been digested.
- Confirm with price clearly above or below the cloud, plus Chikou Span clear of price 26 periods back. Two confirmations, not one.
The multi-timeframe angle matters here. On H4, a decision can distort a developing twist for the better part of a week — you'll see Span A and B wobble across each other as post-event volatility feeds the calculation. On the daily chart, the same event usually shows up as one or two candles of noise before the underlying twist reasserts itself. If you're trading off H4 Ichimoku setups around known decisions, drop down your conviction, not your discipline — the daily chart is the tiebreaker when H4 gives you a twist you don't fully trust.
Gold and central banks: why XAUUSD reacts twice
Gold pays no coupon, so its opportunity cost is the real yield — nominal yield minus expected inflation — and that's why XAUUSD often moves twice on a central bank decision: once with the dollar, then again as real yields reprice. The first leg is mechanical and fast. The second leg is where the money actually gets made or lost.
Real yields, the dollar and the two-stage reaction
Within seconds of a decision, gold FOMC reaction typically tracks the DXY gold correlation — a hawkish surprise strengthens the dollar, gold sells off tick for tick as algos price the interest rate differentials and gold relationship instantly. That's reaction one. Reaction two arrives over the next 15-90 minutes as the Treasury curve settles and traders work out what the decision actually did to real yields. If the hike is hawkish on the nominal rate but the statement or dot plot lifts inflation expectations by even more, real yields can fall even as nominal yields rise. Gold, which prices off the real rate, can grind back up and close green on a day the dollar finished stronger — a divergence that looks contradictory until you separate the two mechanisms.
When gold ignores the dollar entirely
The correlation breaks in three regimes you need to recognize before you trade the "gold always fades a hawkish dollar" assumption:
- Central bank gold buying — sustained reserve accumulation by central banks (a theme the World Gold Council has documented in its annual surveys) puts a structural bid under gold that can absorb a stronger-dollar day without a scratch.
- Geopolitical bids — headline risk pulls gold higher as a safe-haven flow independent of rates, and it can run for days regardless of what the Fed or ECB just did.
- Liquidity-stress days — in a genuine risk-off scramble (think March 2020 or a sudden credit event), gold gets sold alongside equities and everything else as funds raise cash. On those days gold trades as a liquidity asset, not an inflation hedge, and the real-yield model temporarily stops working.
None of these regimes last forever, but each one can make a textbook real-yield trade look wrong for a week before it's right again — know which regime you're in before you fade the move.
Sizing gold through a decision — the ATR reality check
XAUUSD's ATR expansion on a decision day dwarfs what you see on EURUSD or GBPUSD — gold routinely moves several multiples of its normal daily range within the hour, where a major currency pair might move one and a half. The lot size that feels comfortable on a EURUSD FOMC trade is reckless applied to gold at the same nominal risk, because the underlying volatility isn't comparable. Cut your position size specifically for gold going into any central bank decision, treat your stop distance as a multiple of the current ATR rather than a round-number level, and accept that the two-stage reaction means your first fill is rarely your best price — the real move often comes after the dollar's initial knee-jerk has already faded.
Policy divergence in 2026: where the multi-week trends live
Central bank divergence — one bank cutting while another holds or keeps hiking — is what turns a single decision candle into a multi-week trend. The decision itself gets priced in within hours. The trend that actually pays your account builds over the following weeks as the interest rate differential between two currencies keeps widening, pulling carry flows in one direction until something forces a re-price.
The mechanism is simple even if the flows behind it aren't: capital moves toward the currency offering the better expected real return, adjusted for risk. When the Federal Reserve holds while the European Central Bank cuts, the dollar side of EURUSD gets a carry advantage that doesn't disappear the day after the ECB decision — it compounds every week the gap stays open. That's why the best policy trades in our evaluations aren't the ones held for the ten minutes around the print. They're the ones held through three or four subsequent data releases, riding the differential rather than the headline.
Fed vs ECB: the EURUSD differential trade
EURUSD is the cleanest expression of central bank divergence forex traders track, because the pair is a direct read on the Fed–ECB rate gap. When the Fed's path runs hotter than the ECB's — holding rates longer while the ECB front-loads cuts — the EURUSD rate differential trade favours dollar strength on every rally, not just on FOMC day. The trap is treating each ECB press conference as the whole trade. It's one data point in a trend that was already running.
BoJ normalisation and the USDJPY carry unwind
The Bank of Japan is the wildcard on the 2026 board. Years of near-zero rates funded a USDJPY carry trade — borrow yen cheap, buy higher-yielding assets — that's been one of the most crowded positions in G10 FX. As Bank of Japan normalisation continues, even modest, telegraphed rate moves can trigger outsized unwinds, because so much leveraged carry is stacked on the other side. Trail your stop on JPY pairs behind swing structure, not a round number — carry unwinds gap through levels that look obvious on a chart.
The rest of the board: BoE, SNB and RBA
The Bank of England, Swiss National Bank and Reserve Bank of Australia rarely set the primary trend, but they amplify or fade it. A BoE that's more hawkish than the ECB adds a secondary bid under GBPEUR crosses. The SNB's franc-strength tolerance shifts USDCHF positioning around every meeting. The RBA's commodity-linked cycle makes AUD pairs a proxy for China demand as much as domestic policy.
| Central bank | 2026 stance | Primary pair affected | Divergence risk |
|---|---|---|---|
| Federal Reserve | Holding longer than peers | EURUSD, USDJPY | Repricing on weaker US data |
| ECB | Cutting cycle | EURUSD, EURGBP | Catch-up hike risk if inflation sticks |
| Bank of Japan | Slow normalisation | USDJPY, all JPY crosses | Carry unwind on any hawkish surprise |
| Bank of England | Data-dependent, lagging Fed | GBPUSD, EURGBP | Sterling volatility on wage data |
| SNB | Franc-strength management | USDCHF, EURCHF | Intervention risk on rapid franc moves |
| RBA | Commodity-cycle dependent | AUDUSD, AUDNZD | China demand shocks override policy |
Divergence trades don't unwind gently — they unwind violently, the moment the lagging bank catches up faster than the market expected. That's the risk side of this whole approach: your stop belongs behind market structure, not behind a tidy round number that every other trader is also watching. Keep a central bank calendar 2026 open on your desk so none of these six decisions catch you flat-footed mid-trend.
Surviving decision day inside a prop challenge
On a $100,000 evaluation with a 5% daily loss limit, that's a $5,000 budget — and a single oversized gold position through an FOMC print can burn through it in under 90 seconds, often before your stop even fills at the price you set. Decision day doesn't punish direction as much as it punishes size. Get the size wrong and it doesn't matter if you were right on the rate call.
The daily loss limit math: what one FOMC candle actually costs
Take a standard evaluation: $100,000 account, 5% daily loss limit ($5,000), max drawdown typically 10% ($10,000) measured from a static or trailing baseline depending on the challenge tier. Now put a 3-lot (300oz) XAUUSD position on into the FOMC statement drop. Gold's normal ATR(14) on the daily runs roughly $18-22. During the two-minute window around the release, that same instrument can travel 60-80 points — three to four times the normal range — in a single leg, with no fills in between.
Do the arithmetic: 300oz × $70 adverse move = $21,000 of theoretical loss. Even a "reasonable" 1-lot (100oz) position eats $7,000 — already past the daily loss limit and into max drawdown territory, on one trade, on one candle.
ATR-based sizing and stops for a decision session
| Scenario | Position size | Stop distance (ATR-expanded) | Theoretical risk | % of $5,000 daily loss limit |
|---|---|---|---|---|
| Full pre-FOMC size | 3 lots (300oz) | 18pt (normal ATR) | $5,400 | 108% |
| Same size, event ATR | 3 lots (300oz) | 70pt (event range) | $21,000 | 420% |
| Half-size, ATR-expanded stop | 0.5 lot (50oz) | 60pt (3× normal ATR) | $3,000 | 60% |
| Flat into the print | 0 lots | n/a | $0 | 0% |
The lesson in that table: position sizing FOMC events isn't about picking a smaller number and hoping — it's about widening your ATR stop loss to actual event volatility first, then sizing backward from your risk budget. And even the "safe" half-size row assumes your stop fills where you set it. Slippage on a 300-pip-per-minute gold leg routinely runs 5-15 points past the level, so treat every event-session stop as a worst-case estimate, not a guarantee.
Flat into the print, or hold with a rules-based exception
Most traders who pass a prop challenge news trading gauntlet default to flat into the print — no exposure for the 15-30 minutes bracketing the release. It's the position that requires zero heroics and preserves 100% of your daily loss limit for a cleaner setup an hour later. If you do want exposure, two rules-based exceptions work:
- Half-size, 3× ATR stop — accept a wider stop in exchange for a fraction of normal size, capping worst-case loss well under the daily limit.
- No new positions until 15 minutes into the press conference — let the initial algorithmic spike and reversal exhaust itself, trade the confirmed direction instead of the noise.
Daily loss limits and max drawdown rules exist for the same reason institutional risk desks impose VaR limits and position caps — one bad decision session shouldn't be able to end a career, or an evaluation. A For Traders Challenge gives you a live-feeling FOMC candle to test this framework against on simulated capital: you find out what your sizing does under real event volatility, adjust the rule, and only carry that discipline into a Funded Account where performance rewards are actually on the table.
Ready to trade funded capital?
Choose your path — Instant Accounts, One-Step or Two-Step Challenges — from just $23, with up to $300,000 in funded capital.
Choose your challengeTrade the release or wait for the second leg?
Pros
- Waiting for the press conference leg removes exposure to the 0-90 second slippage window where stops fill worst
- Post-print entries let you trade a confirmed direction rather than guessing the surprise
- Sitting flat into the release keeps your daily loss limit intact and preserves the evaluation
- The second leg typically offers a defined structure to place a stop behind, improving R:R versus a spike entry
Cons / risks
- You give up the largest single move of the day if the initial direction holds
- Spreads are still wider than normal at T+15min, so entry cost is elevated
- Some decisions produce no clean second leg at all — you sit on your hands for nothing
- Waiting demands patience most traders don't have when a 100-pip candle just printed on screen
Frequently Asked Questions
How do central bank decisions affect currencies?+
Currencies move on the gap between what the market priced in and what the central bank actually delivers, not the rate itself. A 25bp hike that's already priced does nothing; a hold when 80% of the market expected a cut can send a pair 100+ pips in minutes. Forward guidance and the dot plot matter more than the headline number because they reset expectations for the next three to six meetings. Trade the surprise, not the decision — check the rate probabilities on CME FedWatch or a similar tool before the release so you know what's already baked into price.
How do central bank rate decisions affect forex versus indices and gold?+
Rate decisions hit each asset class through a different channel, so reactions rarely line up. Forex moves on relative rate expectations — it's about the interest rate differential versus other currencies, which is why a Fed hold can still weaken the dollar if the ECB turns more hawkish the same week. Indices react to the discount-rate effect on future earnings, so dovish surprises tend to lift equities even with a weaker growth outlook. Gold trades real yields and the dollar inversely — a hawkish surprise that pushes yields up usually pressures XAUUSD, while a dovish pivot fuels rallies.
What indicators help anticipate central bank policy shifts?+
The clearest signal comes from central bank speeches and minutes in the weeks before the meeting, not the data itself. Track the CME FedWatch tool for rate-hike/cut probabilities, watch core inflation and wage growth prints for the Fed, and follow any shift in forward-guidance language from voting members during the blackout-adjacent period. Bond market pricing — the 2-year yield especially — often front-runs the decision by weeks. Combine these with swap-market pricing for the ECB or BoJ to catch policy divergence building before it shows up in the pair.
How do bank Fed policy analysis teams translate rate decisions into trade guidance?+
Major bank research desks run a repeatable process you can copy on a smaller scale: pre-meeting scenario trees mapping every plausible outcome (hold/hike/cut × hawkish/dovish tone) to a directional bias, then a rapid redline comparison of the new statement against the prior one the second it drops. They score the press conference tone in real time against a hawkish-dovish scale before publishing a client note within 15-30 minutes. Retail traders can replicate this by writing your own scenario tree before the release, so you're reacting to a pre-built plan instead of freezing when the headline crosses the wire.
Can an Ichimoku kumo twist be trusted around an FOMC print?+
A kumo twist forming right into a central bank decision carries less weight than one forming in a quiet session, because the twist reflects Tenkan/Kijun momentum that the event itself can violently override. The cloud twist still marks a genuine shift in medium-term trend bias, but treat any twist within 24-48 hours of an FOMC or ECB decision as provisional until the post-event candle closes beyond the kumo with volume support. Many traders wait for confirmation on the next daily close rather than trading the twist signal in isolation during event week.
What factors are shaping Federal Reserve rate decisions in 2026?+
Core PCE inflation, the labor market's cooling pace, and financial-stability signals from credit markets are the three inputs driving Fed decisions this year. The committee is weighing sticky services inflation against slowing job growth, with dot-plot dispersion among members wider than in prior cycles — meaning more meeting-to-meeting volatility around the decision itself. Fiscal policy and Treasury issuance are also feeding into the Fed's reaction function more than usual. Watch the Summary of Economic Projections at each quarterly meeting for the clearest read on where the committee's median view is shifting.
Where can traders find real-time rate probabilities and forecasts?+
The CME FedWatch tool gives free, real-time Fed Funds futures-implied probabilities and is the industry-standard reference traders and analysts quote. For the ECB and BoJ, overnight index swap (OIS) pricing serves the same function and is available through most professional data terminals and several free financial news sites. Economic calendars from Forex Factory or similar aggregators show consensus forecasts alongside prior readings. Combining futures-implied probabilities with sell-side research notes released in the 24 hours before the meeting gives the most complete picture of what's priced versus what could surprise.
How should position sizing change on a central bank decision day?+
Cut standard position size by half to two-thirds on decision days because ATR typically expands 2-3x the normal session average in the first 15 minutes after the release. Widen stops proportionally using event-adjusted ATR rather than your usual multiple, since a normal stop distance gets clipped by spread widening and slippage before the market even settles into a real direction. Many traders also step aside entirely for the first candle and only size back up once the second leg confirms — trading a event on full size risks a stop-out from noise, not from being wrong on direction.
Should you trade the release or wait for the second leg?+
The data favors waiting for the second leg over trading the initial spike, because the first move after a central bank decision reverses a meaningful share of the time as algos and headline-reading bots overreact before discretionary flow corrects it. The more reliable setup is letting the first 15-30 minutes play out, marking the range, then trading the break of that range with the trend that holds through the press conference. Fading the first tick works occasionally but has a poor risk-reward profile compared to waiting for confirmed follow-through.
How do you trade a Fed decision inside a prop challenge without breaching the daily loss limit?+
Reduce size well below your normal risk-per-trade and know your daily loss limit in dollars before the release, not just as a percentage, so you can calculate exactly how many stopped-out attempts you can absorb. Many challenge traders skip the first candle entirely and trade only the confirmed second leg, since a single event-day loss can breach a 5% daily limit that took days to build room for. If you do trade the release, use a hard stop rather than a mental one — slippage during an FOMC print can blow through a mental stop before you react.
Written by
Marcel Hambálek
Senior Trader, For Traders
Marcel trades Futures and Forex day-trading setups on funded accounts and writes about the executional details most traders skip — order types, slippage, session timing, platform quirks on MT5 and NinjaTrader. Pragmatic, mechanics-first, no fluff.
Follow on LinkedInReady to trade funded capital?
Choose your path — Instant Accounts, One-Step or Two-Step Challenges — from just $49, with up to $300,000 in funded capital.
Choose your challengeTrade up to $300,000
Choose challenge