Indices Trading: Understanding Market Movements
Indices trading guide: how live traders read S&P 500 and NASDAQ moves, event playbooks for FOMC, CPI, NFP, and strategies that survive prop challenge rules.
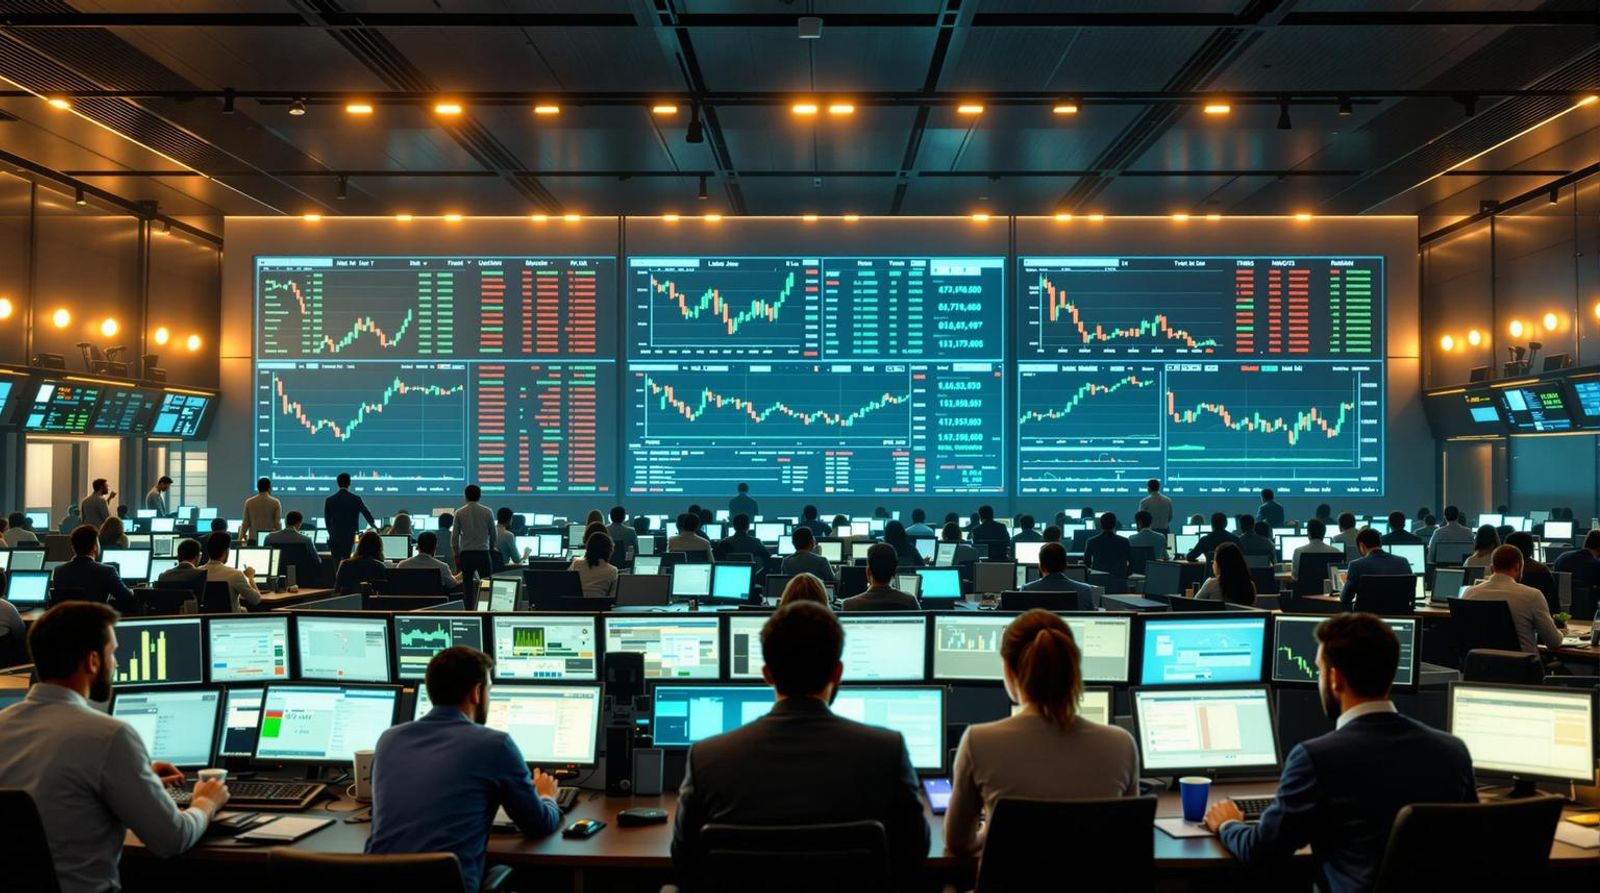
By Marcel Hambálek · Senior Trader, For Traders
Indices trading is speculating on the price of a basket of stocks — the S&P 500, NASDAQ 100, DAX 40 — instead of any single company. You trade the aggregate: the sector rotation, the macro flows, the Fed reaction, without picking winners inside the basket.
Key takeaways
- Major indices (SPX, NDX, Dow, DAX, FTSE, Nikkei) move on macro data, Fed policy, and sector-weighted earnings — not on any single stock.
- Live traders read sudden index moves through sector breadth: if NDX rips but XLK lags, the move is fragile.
- Event trading around FOMC, CPI, and NFP is where most indices intraday volatility lives — and where most challenges die.
- Futures (ES, NQ, YM), CFDs, and ETFs are three different access routes with very different cost, leverage, and tax profiles.
- Prop-compatible indices strategies (opening range, VWAP reversion, breakout retest) work because they define risk in points before entry.
- Position sizing on US100 must be built around daily loss limits — one bad NFP tick can end an evaluation if size is wrong.
Watch: related video
What is indices trading and how does it differ from stock trading?
Indices trading means speculating on the price of a weighted basket of stocks — an entire market or sector — rather than shares in a single company. When you trade the S&P 500, you're not betting on Apple or Microsoft in isolation; you're trading the aggregate behaviour of 500 large-cap US firms at once. That one distinction changes everything about how you analyse, size, and manage the trade.
The basket concept: buying the market, not a company
An index is a constructed benchmark. The S&P 500 weights its 500 constituents by market capitalisation, so the largest companies — tech giants, mega-cap financials — pull the index harder than smaller names. The NDX (NASDAQ 100) tracks 100 non-financial companies listed on Nasdaq, which is why it behaves like a leveraged expression of technology sentiment. The DAX 40 does the same for Germany's 40 largest listed firms.
When you take a position on an index — whether through a CFD, futures contract, or any other instrument — you're not selecting a winner inside that basket. You're expressing a view on the basket itself: the macro environment, sector rotation, central bank policy, and capital flows that move all 500 names in the same direction at once.
Why indices smooth out single-stock noise
Single-stock trading carries idiosyncratic risk at every turn. An earnings miss, an FDA rejection, a CEO resignation — any one event can gap a stock 15% overnight regardless of what the broader market is doing. Indices absorb that noise. When one constituent drops hard on a bad print, it represents maybe 0.5–2% of the index weight. The rest of the basket buffers the move.
This is why indices are typically less volatile than the individual stocks inside them. The diversification is baked in. That doesn't mean they're safe — a Fed pivot or a macro shock hits every constituent simultaneously, and the basket moves with conviction. But the volatility profile is more predictable, which matters when you're sizing positions and setting stops around ATR levels.
Key differences: liquidity, gaps, and news exposure
Three practical differences separate index trading from stock trading:
- Liquidity: Major indices — US100, SPX500, DAX40 — are among the most liquid instruments in the world. Tight spreads, deep order books, and consistent fills even around high-impact events. Individual stocks, especially outside mega-caps, can see spreads widen dramatically at open or around news.
- Gap risk: With a single stock, one earnings report can gap the price past your stop before the market opens. Index gaps happen too — particularly after FOMC decisions or weekend geopolitical events — but the magnitude is structurally capped by the basket effect. No single company blows up the whole index overnight.
- News exposure: This is the trade-off. Indices don't carry company-specific event risk, but they carry everything macro. NFP, CPI, FOMC, GDP — every major macro print moves the whole basket simultaneously. You swap earnings risk for macro risk. Neither is easier; they're just different skill sets.
If you've been trading individual stocks and you're considering the shift to index trading, understand that you're moving from a world where research and company analysis edges you out, to one where macro awareness, session timing, and risk management are the primary differentiators.
The Major and Minor Indices Traders Actually Trade
Not all indices are created equal. The ones that dominate prop and retail volume share three traits: deep liquidity, tight spreads, and near-24-hour futures access. Everything else you trade around them, or you accept the trade-offs consciously.
US Majors: S&P 500, NASDAQ 100, Dow Jones, Russell 2000
The S&P 500 (ES futures, SPX cash) is the benchmark. When institutions hedge equity exposure, they use SPX. When macro traders want a clean read on US risk appetite, they watch SPX. Daily ATR on ES typically runs 40–60 points in normal conditions, spiking well above 100 during FOMC weeks or macro shock events. Liquidity is so deep that even large retail size rarely moves the market — fills are clean, slippage is minimal.
The NASDAQ 100 (NQ futures, US100 on CFD platforms) is where the velocity lives. It tracks the 100 largest non-financial Nasdaq-listed companies — heavily weighted toward mega-cap tech. NQ moves roughly 1.5–2× the daily range of ES, which means faster reward but faster drawdown. During rate-hike cycles, NQ underperforms SPX; during risk-on rallies, it leads. That divergence is information.
The Dow Jones Industrial Average (YM futures) is price-weighted across 30 blue-chip names. It's less representative of the broad market than SPX, but it remains a widely watched headline number. Traders use it mainly as a cross-confirmation tool — if YM is lagging a SPX breakout, the move may lack breadth.
The Russell 2000 (RTY futures) is the one that tells you what risk appetite really looks like underneath the surface. Small-caps don't have the same global revenue diversification as mega-caps, so RTY drops harder in genuine risk-off environments and leads harder in early-cycle recoveries. When SPX is grinding to new highs but RTY is flat or declining, that's a breadth warning worth respecting.
European Majors: DAX 40, FTSE 100, CAC 40, Euro Stoxx 50
The DAX 40 is Germany's benchmark and the most liquid European index futures contract. It's export-heavy — autos, industrials, chemicals — which makes it sensitive to EUR/USD moves and global trade sentiment. The DAX often front-runs US session direction during the European open, making the 07:00–09:00 UTC window particularly active.
The FTSE 100 is dominated by multinationals with significant USD revenues. Counterintuitively, a weaker GBP often supports the FTSE because it inflates the sterling value of overseas earnings. That relationship catches traders off guard if they import a purely risk-on/risk-off framework from US indices.
The CAC 40 skews toward luxury goods and financials. The Euro Stoxx 50 is the pan-European blue-chip basket — useful as a single-instrument proxy for broad eurozone equity exposure, though it lacks the single-country purity of DAX or CAC for macro trades.
Asian Majors: Nikkei 225, Hang Seng, ASX 200
The Nikkei 225 moves in lockstep with USD/JPY more than almost any other index-currency pair globally. A weaker yen boosts Japanese exporters, and the Nikkei often gaps accordingly. If you're trading the Nikkei without watching USD/JPY, you're missing half the trade.
The Hang Seng is the highest-volatility major index on this list in terms of daily ATR relative to price. Policy risk from Beijing, tech regulation cycles, and property sector stress have made it a high-conviction, high-risk instrument. It's not a casual scalp market.
The ASX 200 is quieter — commodities and financials heavy, with lower daily ranges. It's useful as a clean read on Asia-Pacific sentiment without the China-policy overlay of the Hang Seng.
Minor Indices Worth Watching: FTSE MIB, IBEX 35, TSX
When you trade minor indices, you're accepting lower liquidity in exchange for more idiosyncratic moves. The FTSE MIB (Italy) and IBEX 35 (Spain) are heavily weighted toward financials and are acutely sensitive to European sovereign spread widening — BTP-Bund spreads move these markets in ways that don't show up in DAX at all. The TSX (Canada) tracks energy and materials as much as it tracks global equity sentiment, making it a useful cross-reference when crude oil is driving macro flow.
Sector Indices: XLK, XLF, XLE and Why They Matter
Sector ETFs — XLK (technology), XLF (financials), XLE (energy) — aren't typically what you trade directly in a prop challenge, but they're the breadth confirmation layer under the headline indices. If SPX is pushing higher but XLF is flat and XLK is the only driver, the rally is narrow. Narrow rallies fail more often than broad ones. Tracking sector rotation gives you context for whether a breakout has conviction or is just one sector dragging the index.
| Index | Futures Ticker | Typical Daily ATR | Active Session (UTC) | Primary Driver |
|---|---|---|---|---|
| S&P 500 | ES | 40–60 pts (normal) | 13:30–20:00 (23h futures) | Fed policy, earnings, macro data |
| NASDAQ 100 | NQ | 150–250 pts (normal) | 13:30–20:00 (23h futures) | Rate expectations, mega-cap tech |
| Dow Jones | YM | 300–450 pts (normal) | 13:30–20:00 (23h futures) | Blue-chip sentiment, breadth |
| Russell 2000 | RTY | 20–35 pts (normal) | 13:30–20:00 (23h futures) | Risk appetite, credit conditions |
| DAX 40 | FDAX | 150–250 pts (normal) | 07:00–21:30 | EUR/USD, global trade, ECB |
| FTSE 100 | Z | 50–90 pts (normal) | 08:00–16:30 | GBP, commodity prices, BoE |
| Nikkei 225 | NKD / NK | 300–600 pts (normal) | 00:00–06:00 | USD/JPY, BoJ, export earnings |
| Hang Seng | HSI | 300–600 pts (normal) | 01:30–08:00 | China policy, tech regulation |
| ASX 200 | AP | 40–70 pts (normal) | 23:50–05:30 | Commodities, RBA, China demand |
The US100 and SPX dominate prop trading volume for the same reason institutional desks anchor to them: the combination of deep liquidity, tight spreads, and near-23-hour futures access means you can react to any macro event without waiting for a market to open. That's not a luxury when a Fed statement drops at 18:00 UTC — it's a basic requirement for managing risk properly.
How live traders interpret sudden moves in the S&P 500 or NASDAQ
When the S&P 500 jumps 30 points in two minutes, the first question isn't "should I buy?" — it's "is this real?" The difference between chasing a genuine breakout and walking into a liquidity trap is a 30-second mental checklist that professional prop traders run before touching a position.
First question: is this a real move or a liquidity sweep?
Pull up the tick chart immediately. You're looking for one of two signatures: absorption — price grinds through a level with heavy volume and stalls, suggesting a large seller being absorbed — or a clean breakout, where price clears a prior high on expanding volume and holds above it. A liquidity sweep looks different: a fast, impulsive spike that wicks through a key level and snaps back inside within two or three candles. That's not a rally. That's a stop hunt, and the market is already reversing before retail traders have even processed the move.
Check the NYSE TICK indicator at the same moment. A genuine broad move typically prints TICK readings above +800 or below -800 consistently. A single spike to +1000 that immediately collapses to flat tells you one or two large orders fired, not a market-wide shift in sentiment.
Reading breadth in real time (advance/decline, sector heatmap)
Here's a specific scenario every indices trader eventually encounters: NDX rips 80 points in the first ten minutes, but XLK — the Technology Select Sector ETF — is flat or red. That's a mega-cap squeeze, not a broad tech rally. A handful of large-cap names (think the top five weights in the NASDAQ 100, which collectively represent over 40% of the index) are being forced higher by options dealers delta-hedging, while the rest of the sector is going nowhere. These moves fade. Hard. Usually within 30–60 minutes.
In the first minute of any significant index move, scan the sector heatmap in this order:
- XLK (Technology) and XLF (Financials) — the two sectors with the most index weight. If both are green, the move has structural support.
- Count how many of the 11 S&P 500 sectors are participating. If the index is up but six or more sectors are red, you have a narrow, top-heavy move driven by mega-cap concentration — not a regime shift.
- Watch XLE (Energy) and XLU (Utilities) as divergence signals. Risk-off flows rotate into Utilities; a rising SPX with XLU outperforming is a yellow flag on the sustainability of the move.
The advance/decline line (A/D line) gives you the same read in a single number. If SPX is printing new highs but the A/D line is lagging or declining, sector rotation is masking underlying weakness — a classic setup for a sharp mean-reversion trade.
The VIX cross-check — when a spike lies
A falling VIX during an equity rally is confirmation. A rising VIX during an equity rally is a warning you should not ignore. This combination — sometimes called a "negative divergence" — appears before several of the sharpest intraday reversals, particularly around macro events like FOMC decisions or NFP releases.
VIX spikes also lie in the other direction. During low-liquidity overnight sessions, VIX can print an elevated reading simply because options market-makers widen their quotes — not because institutional players are genuinely hedging tail risk. Context matters: a VIX at 22 during the cash session at 10:00 ET with active put buying is a different signal from a VIX at 22 at 02:00 ET when the futures market is thinly traded.
Cash session vs futures session context
The behaviour of index moves changes significantly depending on whether you're in the cash session (09:30–16:00 ET) or the overnight futures session. During cash hours, institutional order flow dominates: program trading, ETF rebalancing, and options expiry mechanics all create structured, high-volume moves that are easier to read with standard tools.
Overnight futures moves are a different animal. Liquidity is thinner — ES futures volume between midnight and 06:00 ET is typically a fraction of cash-session volume — which means a 20-point move in the S&P futures overnight can be driven by a relatively small number of contracts. These moves often fill gaps at the cash open or reverse entirely once real institutional flow enters. Treating an overnight futures rip the same way you'd treat a cash-session breakout is one of the most consistent ways to get stopped out by noise.
The practical rule: during cash hours, trust confirmed breadth moves. Overnight, fade extremes unless there's a clear macro catalyst — an earnings release, a central bank surprise, a geopolitical event — that justifies a structural repricing rather than a thin-market overreaction.
Index event trading: FOMC, CPI, and NFP playbooks
Scheduled macro events don't just move indices — they reset them. The biggest single-session dislocations in US100 and SPX almost always trace back to a Federal Reserve statement, a CPI print, or a Non-Farm Payrolls release. Understanding the sequence of each event, not just the number itself, is what separates a trader who captures the move from one who chases the tail.
FOMC decision days: pre-statement fade, post-Powell drift
The pattern is consistent enough to plan around. In the hour before the 14:00 ET statement release, price typically compresses — ranges shrink, volume dries up, and any directional probe gets faded hard. That compression is the market waiting, not signalling.
At 14:00, the statement drops. You get a spike — often 15–25 SPX points — that frequently reverses within three to five minutes as algos digest the language. The real move starts at 14:30 ET when Powell steps to the podium. His tone on forward guidance, his response to questions about the pace of cuts or hikes, is where conviction forms. The drift that follows a dovish Q&A can extend for 40–60 minutes after the initial statement noise has already shaken out retail stops in both directions.
The playbook: don't trade the 14:00 spike. Mark the high and low of the first five minutes after the statement. Wait for Powell to establish a tone — typically clear by 14:40 — then enter on a retest of the post-statement range break with a stop inside the range. You're trading the drift, not the whipsaw.
CPI release: the first 90 seconds vs the reversal at minute 10
CPI hits at 08:30 ET, pre-cash-open. The first 90 seconds are almost purely mechanical — algorithms repricing rate expectations instantly. A hotter-than-expected print sends US100 down 80–120 points in seconds; a cooler print sends it up a similar amount. The problem is that the first-move direction reverses more often than it holds during those initial 90 seconds.
The more reliable structure emerges between minute 5 and minute 10, once the market has absorbed the headline and traders start pricing the secondary implications. Here's a worked example: if SPX breaks the 08:30 range high after minute 5, enter at the retest of that range high, stop 8 points below the range low, target 2R. That setup gives you a defined risk tied to the structure of the event itself, not an arbitrary level you drew the night before. The range low matters because a genuine bullish repricing shouldn't need to revisit it.
NFP Friday: why 08:30 ET stops get slipped
Non-Farm Payrolls is the event where slippage becomes a real cost, not a theoretical one. Liquidity collapses in the seconds before the 08:30 ET release as market makers widen spreads aggressively. Stops sitting near obvious technical levels — round numbers, prior day's high/low, overnight range extremes — can be skipped by 20 points or more on US100 in a single tick sequence. Your stop order exists; your fill may be nowhere near it.
The practical adjustment: on NFP Friday, either widen stops beyond the likely skip zone before 08:25 ET, or step aside entirely and wait for a five-minute candle close after 08:30 before considering any entry. The move is real, but the first minute of NFP is an auction with almost no bids — you are not getting a fair fill in that window.
Earnings season and the mega-cap effect on NDX
The NASDAQ 100 is a market-cap-weighted index, which means AAPL, MSFT, and NVDA collectively represent a disproportionate share of its daily variance. When one of those three reports after the bell, NDX futures can gap 1–2% on the open of the next session regardless of what the other 97 constituents did. During earnings season — roughly the three weeks following the start of each calendar quarter — this concentration risk is at its peak.
The practical implication for index traders: check the earnings calendar before sizing any NDX overnight position. A position sized for normal volatility can face a gap that exceeds your entire intended risk budget if NVDA misses guidance at 16:30 ET. Reduce size or hedge with defined-risk structures when a mega-cap reports. The index will absorb the move; your account needs to absorb it too.
Indices trading strategies that actually work intraday
The best intraday index strategies share one trait: they exploit a structural edge — session open volatility, mean-reversion to institutional anchors, or the mechanical behaviour of stops around key levels — not a gut feeling about direction. Here are four that translate directly to prop challenge conditions, with the R:R math for each.
Opening range breakout (ORB) on US100
Mark the high and low of the first 15 minutes after the 09:30 ET open on NQ (US100). That range captures the initial price discovery — the institutional orders that have been queued since the previous close hitting the tape at once. Once price closes a 5-minute candle outside that range, you have your signal.
- Entry: Market or limit on the first pullback after the breakout candle closes outside the range.
- Stop: Opposite side of the opening range — if you're long above the high, your stop sits just below the range low. No exceptions.
- Target: 1.5× the opening range width projected from the breakout level.
- R:R: Roughly 1:1.5 by construction. Widen to 2× range if pre-market volume confirms strong directional bias.
This NASDAQ trading strategy fits prop rules well because the stop is defined before entry and sized to the structure, not a round number you picked. On a typical 30-point ORB, you're risking 30 points to make 45 — clean, auditable, and easy to journal.
VWAP reversion during trend days
On days where US100 gaps up and holds above the prior close with expanding volume, the market is in trend mode. Institutions continue buying pullbacks to VWAP — the volume-weighted average price that every desk watches as a real-time fair-value anchor.
- Entry: Price touches VWAP and prints a rejection wick (lower wick at least 50% of the candle body on a 5-minute chart). Enter long on the next candle open.
- Stop: 10 NQ points below VWAP at time of entry.
- Target: Prior intraday swing high — typically 25–40 points above entry on a normal trend day.
- R:R: 2.5:1 to 4:1 depending on the day's range. This is where the strategy earns its keep.
Do not use VWAP reversion on choppy, low-volume sessions where price crosses VWAP repeatedly. The wick rejection is the filter — without it, you're buying into indecision, not a trend continuation.
Breakout retest at prior day high/low
When US100 breaks above the prior day's high with a strong momentum candle, the level flips from resistance to support. The retest — price returning to that exact level — is one of the cleanest indices trading examples you'll find on any timeframe.
- Entry: Limit order at prior day high, confirmed by a bullish engulfing or pin bar on the 5-minute chart.
- Stop: 15 NQ points below the prior day high.
- Target: Next significant structure level — often the prior week's high or a measured move equal to the prior day's range.
- R:R: Minimum 2:1. If the next structure target is closer than 30 points, skip the trade.
This index trading strategy is particularly prop-friendly: the entry is precise, the invalidation is logical, and you're never chasing. You either get filled at the level or you don't trade.
Gap fade — when it works and when it kills you
Gap fading — trading against the opening gap direction — works when price gaps into a prior consolidation zone and there's no macro catalyst driving it. It fails violently when you're fading a gap-and-go.
- Fade it when: The gap is under 0.5% on US100, it opens inside the prior day's range, and there's no major data release within 90 minutes of open.
- Entry: First 5-minute candle close back inside the prior day's range.
- Stop: Beyond the gap extreme — if fading a gap-up, stop above the opening print high.
- Target: Prior day close (the gap fill). R:R is typically 1.5:1 to 2:1.
- Never fade: A gap on the day after an FOMC decision, a gap triggered by a mega-cap earnings beat, or any gap that opens outside the prior week's range. Those are gap-and-go conditions — the gap is the message, not the anomaly.
The distinction matters for your prop challenge account specifically: a single blown gap fade on an FOMC follow-through day can consume 30–40% of your max daily loss limit in minutes. The setup has to earn the risk. If you can't clearly identify the consolidation zone the gap is fading into, it's not a gap fade — it's a guess.
Futures, CFDs, or ETFs: How to Access Indices
The index is the same underlying market regardless of how you access it — but the instrument you trade determines your cost structure, your leverage, your risk math, and whether you can even use it inside a prop challenge. Get this choice wrong and you're solving the right puzzle with the wrong tools.
CME Index Futures (ES, NQ, YM, RTY) — The Prop Standard
CME index futures are the institutional benchmark for index trading, and they dominate prop firm challenges for a reason. Every tick is standardised, every fill is exchange-matched, and there's no dealer sitting between you and the order book. The E-mini S&P 500 (ES) moves $12.50 per tick (0.25 points), so a full point is worth $50 per contract. The E-mini NASDAQ 100 (NQ) moves $5 per tick (0.25 points), putting one full point at $20 per contract. The Micro versions — MES and MNQ — are one-tenth the size, which makes them genuinely useful for sizing into a prop account with a tight daily loss limit.
Futures trade nearly 24 hours on CME Globex, which means the overnight session captures the European open, Asian macro moves, and any pre-market reaction to earnings or geopolitical news. Spreads are consistently tight during regular trading hours — typically one tick on ES and NQ — and the margin requirements are transparent and standardised. No hidden financing charges, no spread markup from a dealer. The risk math is clean: you know your dollar-per-point exposure before you click.
CFDs on Indices — Flexibility, Funding Costs
CFDs on indices offer fractional lot sizing that futures don't, which lowers the barrier to entry for smaller accounts. You can trade 0.1 lots on a US100 CFD where the minimum on NQ futures is one Micro contract. That flexibility is real. But CFDs come with structural costs that compound against you: the spread typically widens 2–4× during high-impact events like NFP or FOMC announcements — exactly when you want to be trading. Overnight financing charges apply to any position held past the daily rollover, which erodes R:R on swing setups. And unlike futures, pricing runs through a dealer, which introduces a conflict of interest on fills during fast markets.
ETFs (SPY, QQQ, DIA) — For Cash Accounts, Longer Holds
SPY, QQQ, and DIA are the equity-market versions of index exposure. They're tax-efficient, liquid, and ideal for longer-horizon positions in a cash account. But for intraday trading they're poorly suited: no leverage without margin, no extended-hours depth comparable to futures, and the bid-ask spread widens meaningfully in pre-market. The R:R math for a 15-minute scalp on SPY simply doesn't work the way it does on ES or NQ. ETFs belong in a different portfolio context — not a prop challenge environment built around defined daily loss limits and fast-moving intraday setups.
Which Route Makes Sense for a Prop Challenge
Futures win, almost without exception, for prop challenge trading. Transparent exchange pricing means your simulated fills mirror real-market conditions accurately. Standardised tick values make position sizing formulaic — you can calculate your max contracts from your daily loss limit and ATR in under 30 seconds. And CME index futures are the benchmark instrument that most serious prop platforms, including For Traders' futures challenges, are built around.
| Instrument | Leverage | Spread (normal conditions) | Overnight cost | Pricing transparency | Prop challenge fit |
|---|---|---|---|---|---|
| CME Futures (ES, NQ) | High (exchange margin) | 1 tick (very tight) | None (roll-based) | Exchange-matched | ✓ Ideal |
| CFDs on Indices | High (dealer-set) | Widens on news | Daily financing charge | Dealer pricing | Acceptable, watch costs |
| ETFs (SPY, QQQ) | Low (cash) / moderate (margin) | Penny spread (RTH only) | None | Exchange-matched | ✗ Poor R:R intraday |
If you're running a futures prop challenge, the instrument choice is already made for you. The work is in understanding the tick value, sizing correctly against your max drawdown parameters, and knowing how the overnight session positions price before the cash open — because that context shapes every gap and pullback setup you'll trade during RTH.
Trading indices on a prop challenge: rules, sizing, and survival
On the For Traders platform, XAUUSD is the single most-traded instrument — but US100 is a close second, and it's not even close after that. If you're running an index-focused prop challenge, you're in good company, and you're also walking into one of the more unforgiving sizing environments in retail prop trading.
Why US100 dominates prop volume
The NASDAQ 100 pulls challenge traders for the same reasons it pulls institutional desks: deep liquidity, clean technical structure, and volatility that actually moves the needle on a $100k simulated account. Forex majors can grind sideways for days. US100 gives you range. That range is the opportunity — and the trap.
Across For Traders evaluations, US100 (traded as NQ futures or the CFD equivalent) consistently ranks as the second-most-traded instrument by volume. Traders come for the momentum setups around macro events — FOMC, CPI, NFP — and stay because the instrument respects technical levels better than most people expect from something this volatile.
Position sizing against daily loss limits
Here's where most challenge accounts die. On a $100k account with a $5,000 daily loss limit, one standard NQ contract at $20 per point means a 250-point adverse move ends your trading day — full stop. That's not a theoretical edge case. A hot CPI print in 2025 moved NQ 400 points in under 90 seconds. One contract, wrong side, no stop — challenge over before London closes.
This is exactly why the majority of experienced challenge traders default to Micro NQ (MNQ) at $2 per point until they've built a cushion inside the evaluation. At MNQ sizing, that same 250-point move costs $500 — painful, but survivable. You retain the ability to re-enter, adjust your thesis, and finish the day with your account intact. Scaling up to full NQ contracts is earned, not assumed.
The math is simple and worth writing on a sticky note next to your screen: daily loss limit ÷ contract point value = maximum adverse move you can absorb at that size. Know your number before the session opens, not during it.
Max drawdown math for index traders
A standard For Traders prop challenge carries an 8% maximum drawdown on a $100k account — that's an $8,000 buffer. At one NQ contract ($20/point), that translates to exactly 400 points of total adverse movement before the account hits the hard ceiling. Four hundred points sounds generous until you've watched NQ swing 600 points in a single volatile session.
At MNQ sizing ($2/point), that same $8,000 buffer covers 4,000 points of adverse movement — an entirely different psychological and tactical environment. You can take setups, absorb heat, and manage trades like a trader instead of a gambler watching a timer. Max drawdown is not a safety net; it's the outer boundary of your risk envelope. Build your position sizing so your daily loss limit is the constraint you hit first, never the max DD.
Rule-compatible strategy shortlist
Not every index strategy survives contact with prop challenge rules. Here's how the approaches covered earlier in this guide stack up against daily loss limits and max drawdown constraints:
- Opening Range Breakout (ORB): High compatibility. Defined entry, clear invalidation level, fixed stop. You know your risk before you're in the trade. Scales cleanly from MNQ to NQ as your cushion grows.
- VWAP reversion: High compatibility. Mean-reversion entries typically carry tighter stops than breakout plays, and the strategy naturally avoids the highest-volatility windows. Fits well inside daily loss limit management.
- Trend continuation / pullback: Moderate compatibility. Works well in trending sessions; struggles when macro events flip the tape mid-session. Requires disciplined stop placement to avoid letting a runner become a challenge-killer.
- Naked news trading (fading or chasing macro releases): Low compatibility. Slippage on fills, gap-through stops, and 400-point candles in 60 seconds make this a direct threat to both your daily loss limit and your max drawdown in a single trade. The risk-reward looks attractive; the fill reality rarely matches the backtest.
The prop challenge environment rewards patience and process. ORB and VWAP reversion score high because they impose structure on you before price does. Naked news trading scores low because it outsources your risk management to market makers who have no interest in your challenge passing date.
Ready to trade funded capital?
Choose your path — Instant Accounts, One-Step or Two-Step Challenges — from just $23, with up to $300,000 in funded capital.
Choose your challengeA worked indices trading example: US100 opening range breakout
The cleanest way to understand an ORB setup is to walk one from pre-market context to close, with real numbers attached. Here is a full US100 trade from entry to exit — including the scenario where you should have stayed flat.
Setup: pre-market range and context
It is a Tuesday. No FOMC, no NFP, no earnings from mega-cap names. NQ futures have been consolidating overnight, building a clean pre-market range between 19,850 and 19,900 — a 50-point band that tells you the market has not made up its mind yet. That indecision is your friend. Tight pre-market ranges tend to resolve with momentum once the cash session opens, because the liquidity vacuum on either side gets filled fast.
You check XLK — the tech sector ETF that acts as a real-time proxy for NASDAQ sentiment. It is flat to slightly green in pre-market. No negative sector rotation signal. You note the broader market context: SPX futures are constructive, no obvious risk-off tone. The setup is alive.
Entry, stop, and target with real numbers
Cash opens at 09:30 ET. Over the first 15 minutes, NQ carves out an opening range between 19,895 and 19,935 — a 40-point range sitting at the top of the pre-market consolidation. The market is already biased upward just by where it chose to range.
Your trigger: a 5-minute candle close above 19,935. At 09:46 ET, that close prints at 19,942. That is your entry.
- Entry: 19,942
- Stop: 19,912 — below the midpoint of the opening range, not the low. Stops at obvious range lows get swept; the midpoint is structurally meaningful and gives you 30 points of risk.
- Risk in dollars (1 NQ contract): 30 points × $20/point = $600
- Target 1 (1R): 19,972 — $600 reward, 1:1
- Target 2 (2R): 20,002 — $1,200 reward, 1:2, the psychological round number acting as a natural magnet
The 1:2 R:R is the minimum worth taking in a prop challenge context. A 30-point stop on NQ is tight but defensible given the defined range — you are not guessing, you are reacting to a confirmed close above structure.
Managing the trade through the first 30 minutes
Price pushes immediately after the breakout candle closes, which is the behaviour you want. Breakouts that stall and chop for 10 minutes before moving often fail. By 09:55 ET, NQ tags 19,972 — Target 1 hit. You exit half the position and move your stop on the remaining half to breakeven at 19,942. The trade is now risk-free on the remaining contracts.
From here, you trail the stop using 5-minute swing lows. Each time a new higher low prints on the 5-minute chart, your stop steps up to just below it — typically 8 to 12 points beneath the swing. This keeps you in the move without giving back meaningful open profit. NQ grinds toward 20,000 through the 10:00–10:15 ET window, and at 10:18 ET it closes a 5-minute candle above 20,002. You exit the second half at 20,002. Total reward on 1 NQ: $600 + $1,200 = $1,800 gross on $600 risk.
Post-mortem: what would have failed the trade
Run this setup on a morning where XLK opens red by 0.4% or more and the picture changes entirely. Sector rotation out of tech at the cash open means the stocks inside the NASDAQ 100 are being sold into strength — the index may break the opening range high, but the follow-through probability drops meaningfully. The breakout prints, you enter, and price reverses within two candles. Stop hit, $600 gone, and the frustrating part is the setup looked identical on price alone.
The filter is the intermarket context. XLK red, or SPX futures diverging lower while NQ attempts the breakout, are reasons to skip the trade entirely — not to widen your stop. In a NASDAQ trading strategy built for prop challenges, skipping a low-probability setup is a positive decision, not a missed opportunity. Your daily loss limit does not care how good the setup looked.
One more failure mode: entering on the first touch of 19,935 rather than waiting for the 5-minute close above it. Price can wick through a level, trigger your entry, and immediately reverse. The close confirmation is not optional — it is the difference between trading structure and trading noise.
Common mistakes that end indices challenges
Most challenge accounts don't blow up on one catastrophic trade. They erode — the same two or three errors repeated until the daily loss limit or max drawdown does the rest. Here are the four that show up most often on NDX and SPX challenges, and the one-line fix for each.
Trading through news you didn't check for
You're in a clean long on US100 at 09:28 ET, structure looks good, volume is building. Then CPI prints hot at 09:30 and the index drops 180 points in 90 seconds. Your stop was 25 points. You're now down 155 points of unplanned exposure because you didn't check the economic calendar before the session.
This isn't bad luck — it's a process failure. FOMC decisions, NFP, CPI, PPI, and core PCE all move indices by multiples of a normal daily range. Getting caught flat-footed in a position during a tier-1 release isn't a trading mistake, it's a preparation mistake. The two are very different, and only one of them is fixable by reading charts harder.
The fix: Calendar check before every session, not per week. Mark the release time, know the expected deviation, and decide in advance whether you're flat into the number or not in the market at all. There is no third option.
Sizing for the win, not the loss
A 1R loss should be a non-event — a cost of doing business. If a single losing trade removes 3% of your simulated account, your position size is built around hope, not risk management. On a Two-Step Challenge with a 10% max drawdown, three consecutive 1R losses at that size puts you a third of the way to termination before lunch.
Proper risk management on indices means defining your stop in ticks or points first, then back-calculating your lot size so the dollar risk stays within your pre-set limit — typically 0.5% to 1% per trade. Not the other way around.
The fix: Set your risk in dollar terms before you touch the size field. The market sets the stop distance; your risk tolerance sets the size.
Fighting trend days with mean reversion
Fed pivot rally. Everything is bid. US100 opens gap-up, pushes through the prior day's high, and keeps going. You fade it once because it "looks extended." It keeps going. You fade it again because now it really looks extended. Third time, you're averaging into a position against a move driven by the largest repricing catalyst in macro trading.
Trend days on indices are not the place for mean reversion logic. When price is making consecutive higher highs on expanding volume with no retracement below the prior 15-minute candle's low, the market is telling you something. Listening costs nothing. Arguing costs drawdown.
The fix: If you've faded the same directional move twice and been wrong both times, your thesis is wrong — not the market. Step back, reassess, or sit out.
Overtrading during lunch chop (11:30–13:30 ET)
The 11:30–13:30 ET window on NDX is where challenge accounts go to die quietly. Volume drops, the institutional order flow that drove the morning session dries up, and price oscillates in a 30–50 point range that looks like it's setting up a breakout every 12 minutes. It never does. You take four trades, scratch two, lose two, and give back half the morning's work.
Overtrading during low-volume mid-session isn't aggression — it's boredom dressed up as analysis. The setups that look compelling at 12:15 ET would never pass your pre-market checklist at 08:45 ET. The filter doesn't change because the clock moved.
The fix: Define your trading hours before the session opens. If your edge is in the open and the close, protect it by not trading between them. A flat P&L at 13:30 beats a red one.
Ready to trade funded capital?
Choose your path — Instant Accounts, One-Step or Two-Step Challenges — from just $23, with up to $300,000 in funded capital.
Choose your challengeFrequently Asked Questions
What is indices trading and how does it work?+
Indices trading means speculating on the price movement of a basket of stocks represented by a single index — like the S&P 500, NASDAQ 100, or FTSE 100 — rather than buying individual company shares. Instead of picking winners stock by stock, you're trading the aggregate direction of an entire market or sector. You access that exposure through futures contracts, CFDs, or ETFs. Each instrument has different margin requirements, trading hours, and cost structures, so the mechanics vary depending on which vehicle you use.
What is the difference between indices trading and stock trading?+
Stock trading means taking a position in a single company; indices trading means taking a position in a weighted basket of companies simultaneously. One bad earnings report can crater a single stock 20% overnight — an index absorbs that shock across hundreds of names. For traders, this means indices tend to trend more cleanly on macro catalysts like FOMC decisions or CPI prints, while individual stocks are more vulnerable to idiosyncratic risk. The tradeoff is that indices offer less explosive upside but more consistent, readable price structure.
Which indices do most active traders actually trade?+
The US100 (NASDAQ 100) and US500 (S&P 500) dominate retail and prop trader volume by a wide margin — they're liquid, they move, and they react predictably to macro events. The Dow Jones (US30) is slower and less popular with intraday traders. Outside the US, the DAX 40 (Germany) and FTSE 100 (UK) are the most actively traded European indices. The Russell 2000 gets attention during risk-on/risk-off rotations as a small-cap sentiment gauge. Minor indices like FTSE MIB or CAC 40 attract specialists but have thinner liquidity and wider spreads.
How do live traders interpret sudden moves in the S&P 500?+
Experienced traders first ask what caused the move — scheduled catalyst like FOMC or CPI, or unscheduled shock like a geopolitical headline. Scheduled events produce a 'buy the rumor, sell the news' pattern traders can anticipate; unscheduled shocks create one-directional momentum that's harder to fade. The next check is volume and follow-through: a spike on high volume that holds above a key level is continuation; a spike that immediately retraces on lower volume is a trap. Most seasoned traders wait for the first 15-minute candle to close before committing size.
What index trading strategies work best for intraday traders?+
Opening range breakout (ORB) is the most widely used intraday strategy — define the high and low of the first 15 or 30 minutes, then trade the breakout with a stop on the other side of the range. Mean reversion at VWAP works well on low-volatility days when price keeps snapping back to the session average. News-fade setups around CPI or NFP exploit the tendency for indices to spike into a level and reverse once the initial reaction is absorbed. All three require tight risk management — indices can move 1-2% in minutes on macro events.
What is index event trading and which events matter most?+
Index event trading means positioning around scheduled macro releases that historically move indices significantly. The Federal Reserve's FOMC rate decisions are the highest-impact events — even the tone of the press conference can shift the S&P 500 by 1-3% intraday. CPI (Consumer Price Index) prints are the second most volatile, especially in rate-sensitive environments. NFP (Non-Farm Payrolls) moves indices but the reaction is less predictable than CPI. Index rebalancing events — when constituents are added or removed — also create mechanical price pressure that traders can anticipate and position around.
What is the difference between trading indices via futures versus CFDs?+
Futures contracts (like the E-mini S&P 500 or Micro NASDAQ on CME) are exchange-traded, have fixed expiry dates, and carry no overnight swap fees — instead, roll costs are embedded in the price. CFDs are OTC instruments offered by brokers and prop platforms; they have no expiry but charge daily swap fees for overnight positions. Futures have tighter spreads and deeper liquidity at scale, making them preferred by professional traders. CFDs offer lower minimum size and are more accessible for retail and challenge accounts. ETFs like SPY are better for swing or position traders who want equity-like exposure without leverage.
How do you trade indices during FOMC without getting stopped out?+
The core rule is to reduce size before the event, not after. A position sized for normal volatility will hit your stop on the initial spike even if your directional view is correct — the market probes both sides before committing. Many traders close all positions 30 minutes before the FOMC statement, then re-enter after the first clear directional candle post-announcement. If you must hold through, widen stops to at least 1.5-2× your normal ATR-based distance and cut position size proportionally to keep dollar risk constant. Trading the second move, not the first, is the professional approach.
Can you trade indices on a prop firm challenge and what are the rules?+
Most prop trading challenges, including those at For Traders, allow indices trading — US100, US500, and major European indices are typically available. The key rules to respect are daily loss limits and maximum drawdown thresholds, which indices can breach quickly during high-volatility events. Holding positions through major scheduled events like FOMC or NFP is often permitted but carries elevated risk of hitting drawdown limits on a single trade. Always check the specific challenge rules on news trading, as some providers restrict holding open positions within a window around high-impact releases.
What position sizing works for indices on a funded challenge?+
Risk no more than 0.5-1% of your challenge account balance per trade on indices — this sounds conservative until you've seen a US100 gap 200 points on an overnight headline. Calculate your stop distance in points, multiply by the contract value per point, and work backward to find the correct lot size. On a $100,000 challenge account risking 1%, that's $1,000 max loss per trade. During high-impact events like FOMC, cut that to 0.25-0.5% to account for slippage and spread widening. Consistent small risk per trade is what separates traders who pass challenges from those who blow up on one bad session.
Written by
Marcel Hambálek
Senior Trader, For Traders
Marcel trades Futures and Forex day-trading setups on funded accounts and writes about the executional details most traders skip — order types, slippage, session timing, platform quirks on MT5 and NinjaTrader. Pragmatic, mechanics-first, no fluff.
Follow on LinkedInReady to trade funded capital?
Choose your path — Instant Accounts, One-Step or Two-Step Challenges — from just $49, with up to $300,000 in funded capital.
Choose your challengeTrade up to $300,000
Choose challenge