Risk-Reward Ratio: How to Use It to Your Advantage
The risk reward ratio explained: exact formula, breakeven win-rate table from 1:0.5 to 1:5, worked EURUSD, XAUUSD and futures examples, plus prop challenge maths.
By Jakub Rož · Founder & CEO, For Traders
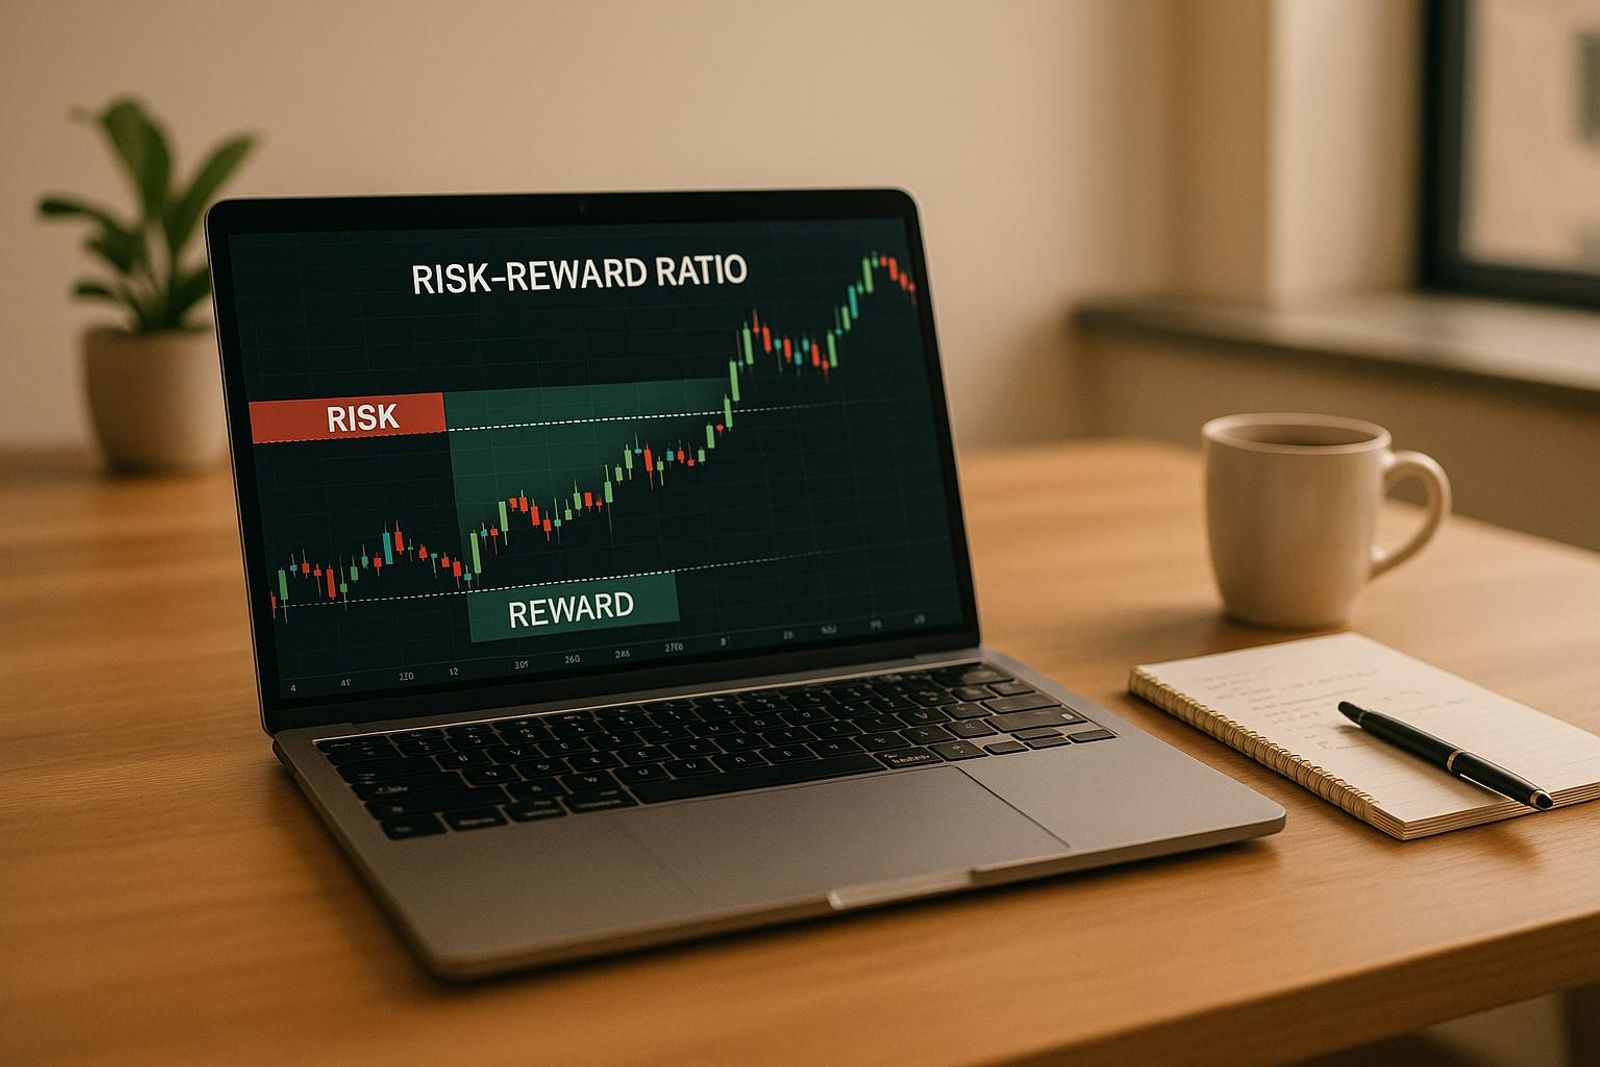
The risk-reward ratio (R:R) compares what you risk on a trade to what you stand to gain: R:R = (Entry − Stop Loss) : (Take Profit − Entry). A 1:2 ratio means risking 1 unit to make 2 — and it only needs a 33.3% win rate to break even before costs.
Key takeaways
- The risk-reward ratio formula is R:R = (Entry − Stop Loss) : (Take Profit − Entry), measured in price distance, not money.
- Breakeven win rate = 1 / (1 + R): 50.0% at 1:1, 40.0% at 1:1.5, 33.3% at 1:2, 25.0% at 1:3 and 16.7% at 1:5.
- A 1:3 strategy that wins only 20% of the time still loses money — R:R without a matching win rate is not an edge.
- Realized R:R is almost always lower than planned R:R because spread, slippage, partial exits and trailing stops all shave the reward side.
- Expectancy — (Win% × Avg Win) − (Loss% × Avg Loss) — is the only number that proves a ratio works; run it on your last 100 trades.
- Inside a prop evaluation, a 1:2 setup risking 1% survives five consecutive losers against a 5% daily loss limit; risking 0.5% doubles that buffer.
Watch: related video
What is the risk reward ratio in trading?
The risk reward ratio (R:R) is the distance from your entry to your stop loss compared to the distance from your entry to your take profit. Written as a formula: R:R = (Entry − Stop Loss) : (Take Profit − Entry). That's it — everything else in this guide is you learning to use that one line properly.
What does RR mean in trading?
If you've spent any time in a trading Discord or journaling template, you've seen "RR" thrown around constantly — "took this at 1:3 RR," "bad RR trade, skip it." RR is just shorthand for risk-reward. Nobody's asking what does RR mean in trading mid-chat because it's assumed knowledge, which is exactly why so many newer traders quietly search it later. Now you know: same thing, no hidden meaning.
Risk-to-reward vs reward-to-risk: is 1:2 the same as 2:1?
Here's where most confusion in search queries actually comes from — and it's a labeling issue, not a math issue. Risk-to-reward ratio writes risk first: 1:2 means you're risking 1 unit to make 2. Reward-to-risk ratio flips the order: the same trade written as 2:1 means reward is 2, risk is 1. Same trade, same numbers, different convention.
- Risk-to-reward (1:2): risk stated first — common in prop firm materials and risk management docs.
- Reward-to-risk (2:1): reward stated first — common when traders talk about "how much I made versus what I put on the line."
Neither is wrong. When you're reading someone's trade recap or comparing setups across a forum, just check which side of the colon comes first before you assume you know what they risked.
The risk reward ratio formula
R:R is measured in price distance — pips on EUR/USD, dollars on XAUUSD, points on the US100, ticks on a CME futures contract — never in account currency directly. Say gold is trading at $2,450, your stop sits at $2,440 (a $10 risk leg), and your target is $2,470 (a $20 reward leg). That's 10:20, simplified to 1:2. Your position size is a separate decision entirely — it converts that price distance into actual dollars at risk once you've set your R:R.
One more thing before you move on: R:R by itself proves nothing. A 1:5 ratio sounds great until you learn the setup only wins 10% of the time. R:R is a planning metric — it tells you the shape of a winning trade, not whether you'll get one. You need to pair it with your win rate before it means anything real, which is exactly where we're headed next.
How do you calculate the risk reward ratio?
Risk reward ratio = (reward distance) ÷ (risk distance), where reward distance is your take profit minus entry, and risk distance is your entry minus your stop loss. It's price arithmetic, nothing more — which is exactly why it works the same whether you're trading EURUSD, gold, or a Nasdaq futures contract.
The three inputs: entry, stop, target
Every R:R calculation needs three prices, and the order you set them in matters:
- Entry — where you actually get filled, not the level you were hoping for. Slippage on a fast market moves this number.
- Stop loss placement — the price where your trade idea is proven wrong, not where you're "willing to lose X dollars." A support break, a structure failure, an invalidated trendline. If you're setting the stop based on dollar comfort instead of chart logic, your R:R is fiction.
- Take profit — the next real structural level: prior swing high, a supply zone, a measured move. Not an arbitrary round number.
Get the sequence wrong — say, picking a target first and reverse-engineering a stop to make the ratio look good — and you've built a number that has nothing to do with the chart.
Step-by-step calculation in four lines
This is how to calculate risk reward ratio on any instrument, in four lines:
- Risk distance = Entry − Stop Loss
- Reward distance = Take Profit − Entry
- R:R = Reward distance ÷ Risk distance
- Express as a ratio (1 : R:R)
Long gold at 2,410, stop at 2,398, target at 2,446: risk distance is 12, reward distance is 36, so R:R = 36 ÷ 12 = 3, or 1:3. Same math on a US100 futures leg or a EURUSD swing — the units change, the ratio doesn't care. Any risk reward ratio calculator is just running these four lines for you; understanding them means you can sanity-check the output instead of trusting it blindly.
From R:R to R-multiples (Van Tharp)
Van Tharp, in Trade Your Way to Financial Freedom, proposed scoring every trade as a multiple of its initial risk — the R-multiple. Your risk distance (step 1 above) becomes 1R. A trade that hits full target at 1:3 is a +3R win. A trade stopped out is −1R. A trade closed for half the planned move isn't a "1:2 win" — it's a +1R win, because you only captured one unit of the risk you took.
This reframing matters for position sizing and journaling. Once results are recorded in R rather than pips or dollars, they're comparable across instruments and account sizes — a +2R gold trade and a +2R FX trade carry identical weight in your stats, even though the dollar amounts differ completely. Journal in R-multiples (+2R, −1R, +0.4R) rather than "won $340" and your expectancy calculations actually mean something the next time you size a trade.
What win rate do you need? The breakeven table for 1:0.5 to 1:5
Your breakeven win rate is the minimum percentage of trades you need to win just to net zero, before a single dollar of profit. Miss it and a "good-looking" risk reward ratio still bleeds your account dry.
The breakeven formula: 1 / (1 + R)
Breakeven win rate = 1 / (1 + R), where R is the reward side of your ratio (risk is always normalized to 1). Plug in a risk reward ratio 1:2 — R = 2 — and you get 1 / (1 + 2) = 33.3%. That's the number quoted in the intro, and it's the whole reason 1:2 gets treated as the sensible default: a coin-flip win rate clears it with room to spare.
Breakeven win rate by ratio (full table)
| Risk:Reward | Breakeven win rate | Realistic (with costs) |
|---|---|---|
| 1:0.5 | 66.7% | ~68-70% |
| 1:1 | 50.0% | ~52-53% |
| 1:1.5 | 40.0% | ~42-43% |
| 1:2 | 33.3% | ~35-36% |
| 1:2.5 | 28.6% | ~30-31% |
| 1:3 | 25.0% | ~27-28% |
| 1:4 | 20.0% | ~22-23% |
| 1:5 | 16.7% | ~19-20% |
Spread, commission, and slippage don't show up in the theoretical formula, but they show up in your equity curve. Across XAUUSD and futures fills alike, expect the real-world breakeven win rate to sit 1-3 percentage points above the textbook figure — a wider stop absorbs costs better than a tight one, which is part of why scalping tight risk reward ratios in trading is punishingly cost-sensitive.
Why a 1:3 that wins 20% of the time still loses money
Here's the trap traders fall into constantly: a 1:3 risk reward ratio "sounds" safe because you can be wrong most of the time and still come out ahead. True — but only above the 25.0% breakeven line. Drop below it and the math turns hostile fast.
Run 100 trades at a 20% win rate on a 1:3 system. You win 20 trades at +3R each = 60R. You lose 80 trades at −1R each = −80R. Net result: −20R for the year, despite a headline ratio that looks aggressive and disciplined on paper. The ratio was never the problem — the win rate was 5 percentage points short of covering it, and that 5-point gap compounds into a real drawdown over a real sample size.
This is why quoting a risk reward ratio on its own — in a trading journal, a signal-seller's marketing, or your own head — tells you almost nothing. Ratio and win rate are a pair, never a standalone claim. Expectancy is what actually pays you: (win rate × average win) − (loss rate × average loss). A 1:3 system needs to prove it can hold 25%+ win rate over a meaningful sample before you trust it with size — anything less and the "great ratio" is just a number that feels safer than it is.
What is a good risk to reward ratio in trading?
There's no universal best risk reward ratio in trading — but most consistently profitable retail plans live between 1:1.5 and 1:3, because that band pairs with win rates humans can actually sustain across hundreds of trades. Ask "what is a good risk to reward ratio in trading" without naming your style and timeframe, and you're asking an incomplete question.
Good R:R by trading style: scalping, intraday, swing, event
The ratio that works is a function of how much time your trade gives price to travel — and how much noise it has to survive on the way. Here's the realistic range by style, based on how these approaches structure entries and exits:
| Style | Typical R:R | Realistic win rate | What breaks it |
|---|---|---|---|
| Scalping | 1:0.8 – 1:1.5 | 60–70% | Spread/slippage eats the edge; one bad session wipes days of grind |
| Intraday | 1:1.5 – 1:2 | 45–55% | Chop days with no follow-through; news spikes stopping you early |
| Swing trading | 1:2 – 1:4 | 35–45% | Overnight/weekend gaps; holding through drawdown you didn't size for |
| News/event | 1:3+ | 25–35% | Slippage on the fill itself; the move you predicted happens, but not at your price |
Why chasing higher ratios lowers your hit rate
This isn't a coincidence in the table above — it's mechanical. Every extra unit of distance you add to your target is another leg of market structure that has to cooperate: another swing high to clear, another session of momentum, another round of buyers showing up before sellers do. Price gets more chances to reverse, retrace, or simply run out of steam before your order fills. A 1:3 risk reward ratio isn't "better" than 1:1.5 in the abstract — it's a different bet on a different amount of time and structure, and the win rate has to fall to compensate. Traders who post screenshots chasing 1:5 and 1:10 setups rarely show you the string of stopped-out attempts it took to land the one that worked.
The honest answer: the ratio your market structure actually offers
Stop importing a ratio from a chart you saw on social media and forcing it onto your setup. Instead, let the market tell you what's available: measure the distance to the next real structural level — the last swing high, a prior range boundary, a liquidity pool — and check it against your stop distance, which should itself be anchored to volatility, not a round number. A stop set at 1.5× Average True Range (ATR) below entry respects what the instrument is actually doing right now; a stop set at a psychological price level gets hunted first. If structure only offers 1:1.3 today, take 1:1.3 — a real, fillable ratio beats an aspirational one you'll never see filled.
Worked examples: EURUSD, XAUUSD, NSDQ100 and CME futures
The math behind R:R doesn't change instrument to instrument — but the units do. A "30 pip stop" means nothing on gold, and "200 points" means nothing on EURUSD. Here's how to calculate risk reward ratio in forex, metals, and futures using the same fixed structure, so you can plug your own numbers straight into a risk reward ratio calculator or spreadsheet.
EURUSD 1:2 — pips, lot size and pip value
- Entry: 1.0850
- Stop: 1.0820 (30 pips)
- Target: 1.0910 (60 pips)
- Risk: 30 pips
- Reward: 60 pips
- R:R: 1:2
Pip value depends entirely on lot size — this is where most new traders miscalculate cash risk without realising it:
| Lot size | Units | Pip value | Cash risk (30 pips) |
|---|---|---|---|
| Standard (1.0) | 100,000 | $10 | $300 |
| Mini (0.1) | 10,000 | $1 | $30 |
| Micro (0.01) | 1,000 | $0.10 | $3 |
Takeaway: the ratio is 1:2 regardless of size — only your cash risk scales, so size is a position-sizing decision, not a strategy decision.
XAUUSD 1:3 — dollars per ounce and contract size
- Entry: 2,412.00
- Stop: 2,398.00 ($14 risk per ounce)
- Target: 2,454.00 ($42 reward per ounce)
- Risk: $14/oz
- Reward: $42/oz
- R:R: 1:3
A standard XAUUSD lot controls 100 ounces, so a $1 move equals $100. On this setup, one standard lot risks $1,400 to target $4,200. Since gold is the most-traded instrument on our platform, this is the setup type our funded traders run more than any other — and it's exactly why the contract-size math has to be automatic, not estimated.
Takeaway: gold's larger point moves feel dramatic, but once you normalise to contract size, $14 risk behaves identically to 30 pips on EURUSD — it's still 1 unit of risk.
US100 CFD and NQ/MNQ futures 1:2.5 — index points and tick value
- Entry: index price, risk 200 points
- Stop: 200 points below entry
- Target: 500 points above entry
- Risk: 200 points
- Reward: 500 points
- R:R: 1:2.5
On US100/NSDQ100 CFDs, cash risk depends on your per-point value. Switch to CME futures and it's tick-based instead: NQ ticks in 0.25-point increments worth $5.00 each (800 ticks in 200 points = $4,000 risk), while MNQ — the micro contract — trades the same tick at $0.50 ($400 risk). ES ticks at $12.50 per 0.25, MES at $1.25. Same index, same 1:2.5 ratio, radically different cash exposure depending on which contract size you choose. Check current specs directly with CME Group before sizing a futures position — tick values are contract-defined, not negotiable.
Takeaway: futures traders scale risk by contract choice (NQ vs MNQ), not by fractional lot sizing like forex — pick the contract that matches your account size, not the other way around.
Comparing all three at equal 1% risk
Normalise every example to 1% risk on a $50,000 account and the instrument differences disappear — this is the entire point of thinking in R-multiples instead of pips, dollars, or points:
| Instrument | R:R | Risk (1%) | Reward at target |
|---|---|---|---|
| EURUSD | 1:2 | $500 | $1,000 |
| XAUUSD | 1:3 | $500 | $1,500 |
| US100 / NQ | 1:2.5 | $500 | $1,250 |
Different units, different tick values, same discipline: risk 1%, size the position backward from your stop, and let the R:R do the rest.
Ready to trade funded capital?
Choose your path — Instant Accounts, One-Step or Two-Step Challenges — from just $23, with up to $300,000 in funded capital.
Choose your challengePlanned vs realized R:R: why your actual ratio is worse
The R:R on your chart is a fantasy until the trade closes. Spread, slippage, and how you actually manage the position all eat into the number — and across most retail systems, a planned 1:2 or 1:3 closes out closer to 1:1.5-1.8 in practice. If you're calculating your edge off the planned ratio instead of the realized R multiple, your breakeven math is wrong.
Where the drag comes from: spread, commission, slippage
Take a straightforward EURUSD trade: 30-pip stop, planned 1:2, 1.2-pip spread, and a conservative 0.5-pip average slippage and spread cost on both entry and exit. That's roughly 2.2 pips of round-trip drag on a 30-pip risk unit — about 7% of your R gone before the market even trends in your favor. A "1:2" setup realizes closer to 1:1.8.
On XAUUSD the drag is smaller in percentage terms but bigger in dollars. A $0.35 spread plus news-time slippage around NFP or FOMC can cost $1-2 per ounce on entry and exit combined — real money on a full lot, and it compounds every time you're in the market during high-impact releases.
| Instrument | Stop (pips/points) | Spread + slippage drag | Planned R:R | Realized R:R |
|---|---|---|---|---|
| EURUSD | 30 pips | ~2.2 pips | 1:2 | ~1:1.8 |
| XAUUSD | $5.00 | $1–2 (news-time) | 1:3 | ~1:2.6 |
| US100 | 40 pts | 2–3 pts (fast tape) | 1:2.5 | ~1:2.2 |
Partial exits and trailing stops quietly cut your R
Spread and slippage are the small leak. The bigger one is how you manage the trade. Scale out half your position at 1R and trail a stop on the rest, and the average realized R multiple across a sample of trades typically lands around 1.2-1.4 — even on a system marketed and backtested at 1:3. You're locking in 1R on half the size, then giving the trailing stop room to breathe on the other half, which usually gets clipped for 1.5-2R instead of riding to the full target.
That shift matters more than most traders realize: a system needing a 25% win rate to break even at 1:3 planned suddenly needs 42-45% at a 1.2-1.4 realized average. If your actual win rate sits at 35%, you're underwater — even though your journal shows "1:3 R:R" at the top of every trade plan.
How to measure your realized R in a trading journal
- Log the planned R:R at entry — stop distance, target distance, position size.
- Log the realized R on the closed trade — actual entry fill, actual exit fill(s), including every partial exit and where the trailing stop got hit.
- After 50 closed trades, average both columns separately.
- Compare: if planned average is 1:2.5 and realized average is 1:1.5, recalculate your breakeven win rate off 1.5, not 2.5.
Manage your trades however suits your style — scaling out, trailing, whatever lets you sleep at night. Just do the math on realized R, not the number that looked good on the chart before you clicked buy.
Plugging R:R into expectancy: the only number that proves an edge
A pretty risk-reward ratio means nothing if it loses money over a large sample. Expectancy is the number that actually tells you whether your system has an edge — it folds R:R and win rate into one figure, expressed either in currency or, more usefully, in R-multiples.
The expectancy formula
The classic version: Expectancy = (Win% × Avg Win) − (Loss% × Avg Loss). That works fine if every trade risks the same dollar amount, but it gets messy once position sizes vary. The cleaner version normalizes everything to R, where 1R equals whatever you risked on that trade:
Expectancy in R = (Win% × Avg R won) − (Loss% × 1)
Loss% is always multiplied by 1 because a full loss, by definition, is −1R. This is the version every serious trading journal should be built around — it lets you compare a scalping system on XAUUSD to a swing system on NSDQ futures using the same yardstick.
A worked 100-trade sample you can copy
Take a trader logging 100 trades: 38 wins averaging +2.1R, 62 losses averaging −1.0R.
(0.38 × 2.1) − (0.62 × 1.0) = 0.798 − 0.62 = +0.18R per trade.
Over 100 trades that's +18R total. At 0.5% risk per trade, that's roughly 9% account growth before spreads, commissions, and slippage — a real edge, despite a sub-40% win rate.
Now compare a system that looks more impressive on paper — a 1:3 ratio at 22% win rate:
(0.22 × 3) − (0.78 × 1) = 0.66 − 0.78 = −0.12R per trade.
Negative expectancy, despite the prettier ratio. This is the exact trap covered earlier: a wide reward multiple doesn't rescue a win rate that can't feed it enough winners.
| System | Win Rate | Avg R Won | Expectancy per Trade | Result over 100 trades |
|---|---|---|---|---|
| System A | 38% | +2.1R | +0.18R | +18R |
| System B | 22% | +3.0R | −0.12R | −12R |
Expectancy per R and what a healthy number looks like
Anything consistently above +0.10R to +0.15R per trade, across a real sample, is a system worth defending through drawdown. Below zero, no amount of discipline saves it — you're funding the market's edge, not yours.
Pull your last 100 trades from your journal. Compute win rate, average R won, average R lost. Only after that math should you judge whether your ratio is actually working — and remember expectancy needs a large enough sample to mean anything; ten trades tells you nothing, a hundred starts to, and futures traders churning through CME contracts intraday can hit that sample size in weeks, not months.
Where the stop actually goes: structure, ATR or round numbers
The stop goes where the trade idea is proven wrong — not at whatever distance makes the ratio look good on your trade planner. Work backward from a manufactured 1:3 and you'll blow through your daily loss limit on the first bad week; work forward from structure and ATR, and the ratio becomes a byproduct of a real setup instead of a spreadsheet fantasy.
Structure first: invalidation, not a fixed pip count
Before you touch position sizing, define the level that breaks your thesis. That's below the swing low that built the higher-low sequence, beyond the order block that triggered the move, or outside the range you're fading. If price trades through that point, you weren't early — you were wrong. A stop placed at a round 20 or 50 pips because "that's what I always use" ignores market structure entirely, and it shows up in your journal as stops that get clipped on noise, not on invalidation.
ATR multiples: sizing the stop to current volatility
Once you've marked structure, run the sanity check with Average True Range (ATR). A stop tighter than 0.5× the daily ATR on a swing setup, or inside 1× the 14-period ATR on your entry timeframe, is noise-bait — you're getting stopped by the instrument's normal breathing room, not by a change in the trade's validity. This matters across asset classes: XAUUSD can chew through $15-20 of daily ATR without blinking, while a CME micro futures contract on the US100 has its own volatility signature entirely. Size your stop to what the instrument is actually doing right now, not to what felt right on yesterday's chart.
Why round numbers get hit first
Round numbers — 1.0800 on EURUSD, 2,400.00 on gold, 20,000 on the NSDQ — sit on top of clusters of resting liquidity: stops, limit orders, algo triggers all parked at the same clean level. Price gets pulled to them, wicks through, and reverses. Placing your stop exactly on the round number puts you first in line to get swept before the real move continues. The fix is mechanical: put the stop 1.2-1.5× ATR beyond the level, not on it, so the wick has to travel further to take you out.
This is also where the most common R:R fraud creeps in. You find a setup that structurally offers 1:1.5 — stop below a solid swing low, take profit at the next resistance — and it's not exciting enough. So you drag the stop tighter, inside the noise, and suddenly the same trade "offers" 1:3. Nothing about the trade changed except your willingness to get stopped out by randomness. If structure and ATR together don't support the ratio you want, the answer isn't to cheat the stop closer — it's to skip the trade. That's the actual discipline the risk-reward ratio is supposed to enforce, not a number you reverse-engineer to feel better about position sizing.
High risk reward gold strategies: what the backtests don't tell you
Search "high risk reward ratio gold trading strategy" and you'll get a wall of MQL5 Expert Advisor listings showing 1:5 and 1:8 backtests with clean equity curves. Almost none of them show live forward results, and that gap is where most gold accounts get blown. Here's the honest version: gold's real daily range and real execution costs cap what's actually achievable, and the number is closer to 1:2 to 1:2.5 than anything with a 5 in it.
Why backtested 1:5 XAUUSD systems fail forward
Three things break these systems the moment they go live, and every one of them gets hidden inside backtest assumptions:
- Spread modelling. Most MQL5 Expert Advisor backtests run on fixed or historical spreads that undercut what you actually pay. Live XAUUSD spread runs $0.30–$0.80 depending on broker and session — wide enough to eat a meaningful chunk of a tight stop before price even moves.
- No slippage around news. Backtests assume your fill happens where you clicked. Around FOMC and NFP, gold gaps and re-quotes — your stop can execute $2–$5 away from the level you set. A strategy that only works with perfect fills doesn't survive its first live NFP print.
- Stops too tight for the ATR. A 1:5 ratio with a realistic target needs an absurdly tight stop relative to gold's actual movement. On a day with a $15–$30 Average True Range (ATR), a $4–$6 stop gets taken out by normal noise, not by being wrong. The backtest doesn't feel this pain because it doesn't model wick-through-stop-then-reverse — live trading does, every day.
ATR-aware stop and target maths on gold
Structure your stop and target off the ATR, not off a round number or what "feels" right. The table below shows what's realistic versus what the EA listings are selling you.
| Daily ATR | Stop (0.7–0.9x ATR) | Realistic target (1:2–1:2.5) | "1:5" target claimed by backtests |
|---|---|---|---|
| $15 | $11–$14 | $22–$35 | $55–$75 |
| $22 | $16–$20 | $32–$48 | $80–$100 |
| $30 | $21–$27 | $42–$68 | $105–$150 |
A $16–$20 stop on a $22 ATR day giving a $32–$48 target is a workable, defensible 1:2 to 1:2.5 gold trading strategy. Hitting the $80–$100 target in that same "1:5" column requires a genuine trend leg — the kind gold only delivers a handful of times a month, usually around a macro catalyst, not on a random Tuesday.
A realistic gold R:R framework
Size your stop to 0.7–0.9x the current ATR, not a fixed dollar figure carried over from yesterday. Target 1:2 to 1:2.5 as your default, and treat any 1:4+ setup as opportunistic — something you take when structure and momentum align, not something you plan every trade around. Since XAUUSD is the most-traded instrument on the For Traders platform, this maths affects more challenge accounts than any other symbol on the desk — get the ATR-to-target relationship wrong here and it shows up in your gold trading strategy results faster than in any other market you trade.
Pros and cons of a high risk-reward strategy
Pros
- A low breakeven win rate — 25% at 1:3 — means you can be wrong three times out of four and still grow the account
- One winner covers several losers, which shortens drawdown recovery inside a max DD limit
- Fewer, larger targets suit part-time traders who can't monitor screens all session
- Set-and-forget execution reduces the temptation to manage trades emotionally
Cons / risks
- Long losing streaks are statistically normal at 25-30% win rates and psychologically brutal in an evaluation
- Distant targets are hit less often, so realized R drifts well below planned R
- Spread, swap and slippage compound over longer holds, especially on XAUUSD and index CFDs
- The ratio is easy to fake by tightening the stop, which raises stop-out frequency instead of edge
Ready to trade funded capital?
Choose your path — Instant Accounts, One-Step or Two-Step Challenges — from just $23, with up to $300,000 in funded capital.
Choose your challengeFrequently Asked Questions
What is the risk-reward ratio in trading?+
Risk-reward ratio (R:R) compares how much you're risking on a trade against how much you stand to gain if it plays out. You calculate it by dividing your potential profit by your potential loss, based on where you place your stop and target before entry. A 1:2 ratio means you're risking $1 to make $2. It's not a prediction of outcome — it's a structural measure of the trade's payoff, and it only means something combined with your actual win rate.
What does RR mean and is 1:2 the same as 2:1?+
RR is trader shorthand for risk-reward ratio, and 1:2 is not the same as 2:1 — order matters. 1:2 means risk 1 unit to make 2 (a favorable setup), while 2:1 means risk 2 units to make 1 (an unfavorable one unless your win rate is very high). Convention in most prop trading and retail circles writes risk first, so always confirm which number is which before comparing setups or quoting a strategy's stats.
How do you calculate the risk-reward ratio?+
The formula is: R:R = (distance from entry to target) ÷ (distance from entry to stop). Say you enter XAUUSD at 2,410, stop at 2,395 (15-point risk), and target 2,440 (30-point reward) — that's 30 ÷ 15, a 1:2 ratio. Do this in price distance, not dollars, so it works the same whether you're sizing 0.1 lots or 5 lots. Always set both stop and target before entry; calculating R:R after the fact just tells a story that fits the outcome.
What win rate do you need to break even at different R:R?+
Break-even win rate = 1 ÷ (1 + R:R multiple). At 1:1 you need 50% winners, at 1:2 you need about 33%, at 1:3 around 25%, and at 1:5 just 17%. This is why traders chase higher R:R — it buys room to be wrong more often and still survive. But it's theoretical: it ignores spread, slippage, and the fact that stopped-out trades often get stopped at worse prices than the plan, so treat these numbers as a floor, not a target.
What is a good risk-reward ratio in trading?+
Most consistently profitable traders run somewhere between 1:1.5 and 1:3, matched to a strategy with a proven win rate — there's no universal "good" number in isolation. Scalpers on US100 often run near 1:1 with a high win rate; swing traders on gold or futures often push 1:3 or higher with fewer, more selective entries. The number only means something next to expectancy: a beautiful 1:5 ratio with a 10% win rate still loses money. Match R:R to your holding period and actual backtested hit rate, not to what sounds impressive.
Is a 1:3 risk-reward ratio realistic or just marketing?+
A 1:3 ratio is realistic on trending instruments with patience, but it's harder to hit consistently than most marketing implies. Gold and index futures can deliver 1:3 legs on clean breakouts or pullback entries in trending conditions, but choppy or range-bound sessions kill the win rate needed to make it profitable. The honest version: 1:3 works as an occasional outcome in a strategy averaging closer to 1:1.5–2 overall, not as a guarantee on every single trade you take.
How do you calculate risk-reward ratio in forex with pip value?+
Convert both stop and target distances into pips, multiply each by your pip value (determined by lot size and pair), then compare the dollar risk to the dollar reward. Example: 1 standard lot on EURUSD, pip value ≈ $10, stop at 20 pips ($200 risk), target at 50 pips ($500 reward) — that's a 1:2.5 R:R. The ratio itself doesn't need dollar conversion since pips cancel out, but knowing the dollar figures matters for position sizing against your daily loss limit.
Why is realized R:R almost always worse than planned R:R?+
Slippage, spread, and early exits erode the ratio between plan and execution — your stop rarely fills at the exact price, and fear often closes winners before the target. On XAUUSD, with ATR often running $15-30 a day, a few points of slippage on a tight stop can shave meaningful percentage off a planned 1:2. The fix isn't a bigger planned ratio — it's accounting for realistic slippage in your stop distance and letting trailing rules, not emotion, decide early exits.
How does R:R interact with a prop challenge daily loss limit?+
Your risk per trade needs to leave room for multiple losses without breaching the daily loss limit, which caps how much R:R math you can afford to test in one session. If your daily loss limit is 5% and you risk 1% per trade at 1:2, you can absorb five straight losers and still be in the game; risk 2.5% per trade and two losses end your day. Favorable R:R doesn't protect you from max drawdown rules — position sizing against the limit does that, and the two decisions have to be made together, not separately.
Written by
Jakub Rož
Founder & CEO, For Traders
Jakub founded For Traders to build a prop trading firm with multi-asset coverage — Forex, Gold, Crypto and Futures — under a single funded-trader framework. He writes about how the prop industry actually works, what drives long-term trader performance, and where Gold and Forex strategies intersect with disciplined risk.
Follow on LinkedInReady to trade funded capital?
Choose your path — Instant Accounts, One-Step or Two-Step Challenges — from just $49, with up to $300,000 in funded capital.
Choose your challengeTrade up to $300,000
Choose challenge