MACD Crossover: When to Buy or Sell
Master the MACD crossover in 2026 with a rules-based playbook: bullish vs bearish setups, RSI + volume filters, and a multi-timeframe workflow.
By Marcel Hambálek · Senior Trader, For Traders
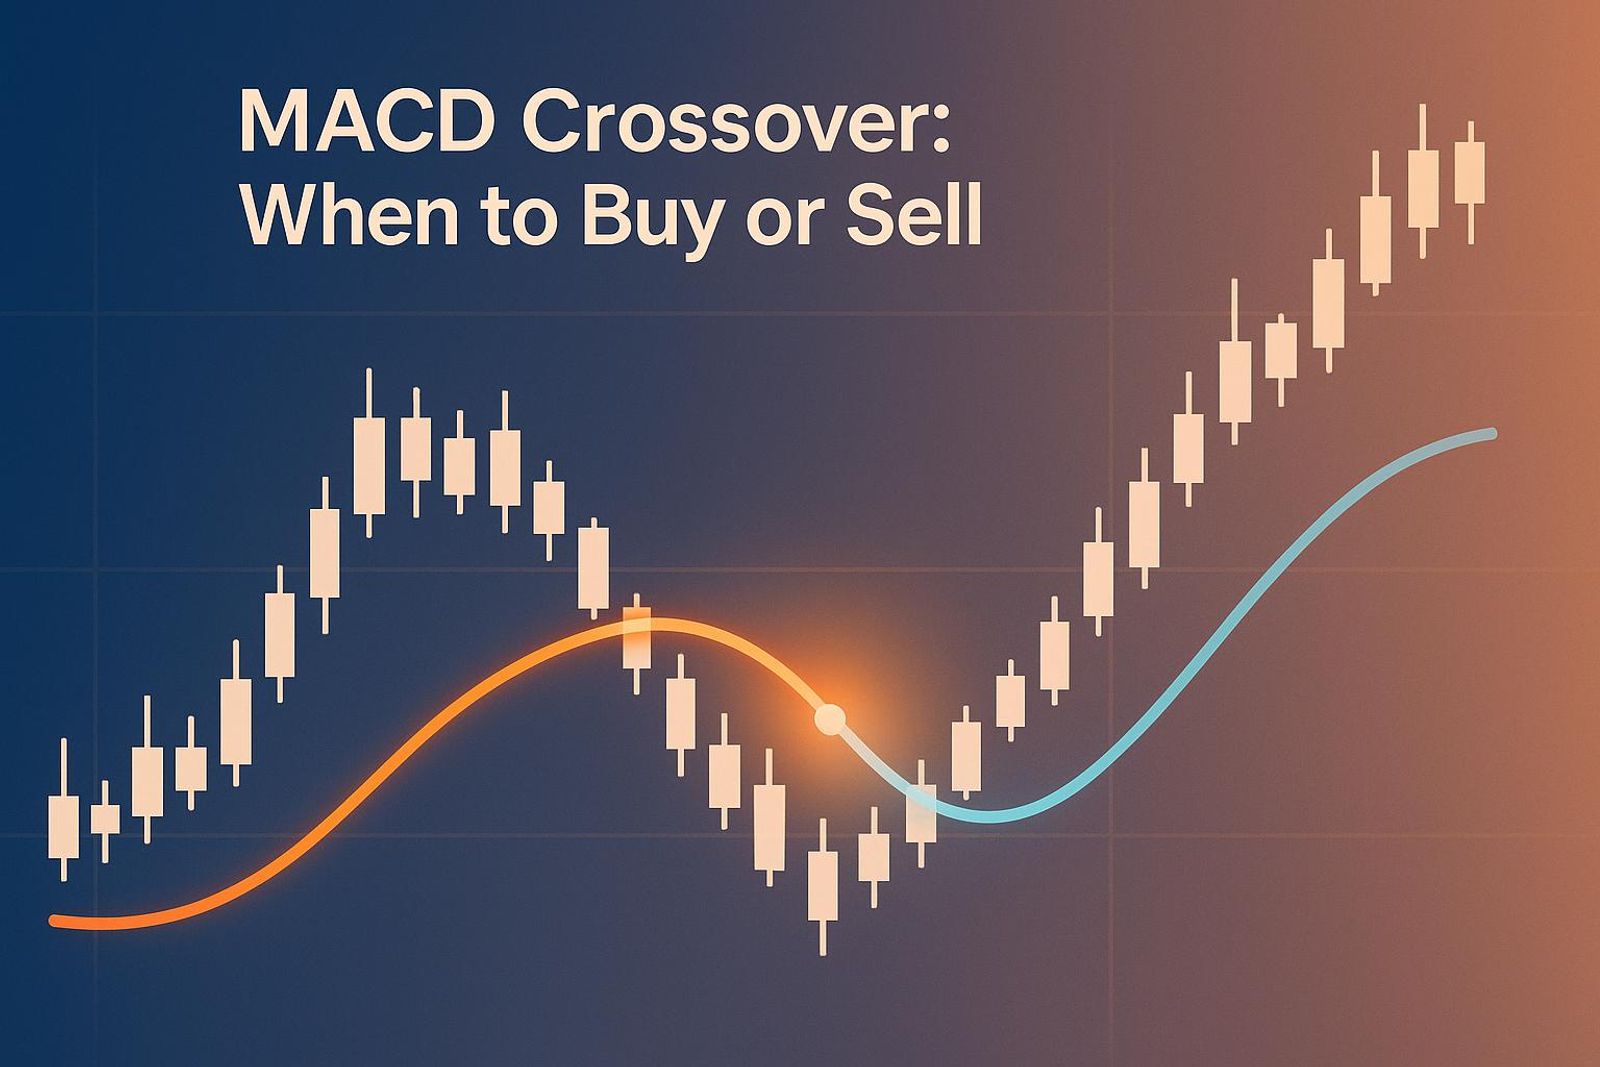
A MACD crossover occurs when the MACD line (the difference between the 12-period and 26-period EMAs) crosses its 9-period signal line — a bullish crossover when it crosses above, a bearish crossover when it crosses below — and it's used to flag momentum shifts in a trending market.
Key takeaways
- MACD crossovers signal momentum shifts but produce false signals in ranging markets — filters are non-negotiable.
- A bullish crossover below the zero line is a stronger reversal signal; one above zero confirms trend continuation.
- Pairing MACD with RSI (30/70 thresholds) and volume confirmation dramatically improves win rate on the 4-hour and daily timeframes.
- Moving average crossovers lag more than MACD crossovers because MACD reads the distance between EMAs, not just their cross.
- Multi-timeframe alignment (daily bias → 4H trigger → 1H entry) is the workflow most successful prop traders use.
- Backtest the full rules set on a simulated For Traders challenge account before risking real capital or a payout.
Watch: related video
What is a MACD Crossover?
A MACD crossover occurs when the MACD line crosses above or below its 9-period signal line, signalling a potential shift in momentum — bullish when it crosses above, bearish when it crosses below.
That one sentence is the core of it. Everything else — the settings, the histogram, the divergence plays — is built on top of that simple relationship. Gerald Appel developed the Moving Average Convergence Divergence indicator in the late 1970s specifically to give momentum traders a systematic way to read trend changes without staring at raw price action and guessing. Nearly five decades later, it's still one of the most-used indicators on every charting platform in existence, from TradingView to MT5. That longevity isn't nostalgia. It's because the underlying logic — momentum precedes price — holds across timeframes and asset classes.
The three components: MACD line, signal line, histogram
The MACD indicator has three moving parts, and confusing them is the fastest way to misread a setup:
- MACD line: The difference between the 12-period EMA and the 26-period EMA of price. When the faster 12-period EMA is above the slower 26-period EMA, the MACD line is positive. When it's below, the line is negative. This line tracks momentum directly — how much separation exists between two moving averages.
- Signal line: A 9-period EMA of the MACD line itself. Think of it as a smoothed version of momentum. It reacts more slowly than the MACD line, which is exactly what makes the crossover meaningful — when the faster line punches through the slower one, something has changed.
- Histogram: The visual representation of the gap between the MACD line and the signal line. When the histogram bars are growing, momentum is accelerating. When they're shrinking, momentum is fading — often before the crossover actually happens. Experienced traders watch the histogram contraction as an early warning, not a lagging confirmation.
How the crossover is calculated
The math is straightforward. Take any closing price series:
- Calculate the 12-period EMA of closing prices.
- Calculate the 26-period EMA of closing prices.
- Subtract: MACD Line = 12 EMA − 26 EMA.
- Calculate a 9-period EMA of the MACD line — this is your signal line.
- Subtract again: Histogram = MACD Line − Signal Line.
The crossover event itself is the moment step 3 and step 4 switch sides. When the MACD line crosses above the signal line, the histogram flips from negative to positive. When it crosses below, the histogram flips negative. Your charting platform calculates all of this automatically, but knowing the mechanics stops you from treating the indicator like a black box.
Who created MACD and why it still works in 2026
Gerald Appel published the MACD concept in the late 1970s when technical analysis was still largely hand-drawn on paper charts. His insight was elegant: instead of just plotting two moving averages and eyeballing where they crossed, measure the distance between them and track how that distance changes. That derivative view of momentum is what gives MACD its edge over a simple MA crossover system.
The reason it still works in 2026 is the same reason it worked in 1979 — markets are driven by human behaviour, and human behaviour creates momentum cycles. Whether you're trading XAUUSD on a 4-hour chart or US100 futures on a 15-minute chart, the compression and expansion of those EMA spreads reflects real shifts in buying and selling pressure. The settings (12, 26, 9) have become a self-reinforcing standard: because so many traders and algorithms reference those exact parameters, the signals they generate carry weight beyond pure mathematics.
Bullish MACD Crossover vs Bearish MACD Crossover
A bullish MACD crossover fires when the MACD line crosses above the signal line; a bearish crossover fires when it crosses below. Same mechanic, opposite implications — and the difference in how you act on each one can define whether you're trading momentum or fighting it.
What does a bullish MACD crossover mean?
When the MACD line crosses above the signal line, the gap between the 12-period and 26-period EMAs is expanding in the bulls' favour. Buying pressure is accelerating faster than the recent average — that's the core message. It doesn't mean price is already moving hard; often the crossover happens while price is still grinding sideways or just beginning to curl off a low. That's the edge: you're reading momentum before it becomes obvious on the candles.
Take a classic XAUUSD 4-hour setup. Gold has been selling off for three sessions, price finds support near a prior swing low, and then the MACD line — still below zero, still negative — hooks upward and crosses the signal line. That bullish MACD crossover below the zero line is your early warning that the sellers are losing grip. Combine it with RSI recovering from the 35–45 zone and a volume uptick on the last bullish candle, and you have a confluence stack worth acting on. Entry goes above the crossover candle's high; stop goes below the swing low. Clean.
The strongest bullish MACD cross signals tend to appear when the histogram has already been printing progressively smaller negative bars — the compression tells you the bearish momentum is bleeding out before the line actually crosses.
What does a bearish MACD crossover signal?
A bearish crossover — MACD line dropping below the signal line — tells you the spread between those two EMAs is contracting and reversing in the bears' direction. Selling pressure is gaining dominance. This is the signal that has saved accounts on US100 pullbacks: you're long from a breakout, the index has run hard, and then the MACD starts curling — histogram bars shrinking, then flipping — before price has even dropped a meaningful number of points.
On a US100 15-minute chart during a post-FOMC drift lower, a bearish MACD crossover above the zero line is particularly meaningful. It's happening in overbought territory, RSI is cooling from above 60, and volume on down-candles is picking up. That's not noise — that's distribution. The MACD cross signal here isn't telling you the trend reversed; it's telling you the upside momentum that was carrying price is now exhausted. Whether you exit longs or flip short depends on your broader read, but ignoring that crossover because "the trend is still up" is how runners become reversals.
Side-by-side comparison table
| Factor | Bullish MACD Crossover | Bearish MACD Crossover |
|---|---|---|
| Signal definition | MACD line crosses above signal line | MACD line crosses below signal line |
| Market context (strongest) | Pullback in uptrend; crossover near or below zero line | Rally in downtrend; crossover near or above zero line |
| Ideal RSI reading | 35–50 (recovering from oversold, not overbought) | 50–65 (fading from overbought, not yet oversold) |
| Volume expectation | Rising volume on bullish candles confirming the cross | Rising volume on bearish candles confirming the cross |
| Histogram behaviour | Progressively smaller negative bars before cross | Progressively smaller positive bars before cross |
| Real market example | XAUUSD 4H reversal off swing low | US100 15-min fade after FOMC spike |
| Typical trader action | Look for long entry above crossover candle high | Tighten stops on longs or scout short entry below crossover candle low |
| Key risk | False signal in choppy, range-bound conditions | Premature exit in strong trend; whipsaw on low-volume crosses |
The table isn't a checklist to run mechanically — it's a framework for weighting signals. A bullish MACD crossover above signal line with RSI at 72 and shrinking volume deserves far less conviction than the same cross with RSI at 42 and a volume surge. Context doesn't just refine the signal; it determines whether the signal is worth trading at all.
Above Zero vs Below Zero: Why Location Changes Everything
Where the MACD crossover happens on the histogram matters as much as the crossover itself. The zero line is the level where the 12-period EMA and 26-period EMA are exactly equal — cross above it and short-term momentum is outpacing long-term momentum; sit below it and the reverse is true. A bullish crossover above zero means something different from a bullish crossover below zero, and trading them identically is one of the more common ways traders leave edge on the table.
MACD bullish crossover above the zero line
When the MACD line crosses above the signal line while both are already above the zero line, you're looking at a trend continuation signal. Price has already established upward momentum — the 12 EMA is running above the 26 EMA — and the crossover is telling you that short-term buyers are re-accelerating after a brief pause or pullback. Think of it as a dip buy within an established uptrend rather than a fresh directional bet.
This is the natural home of swing traders who are already positioned in the direction of the trend. A bullish MACD crossover above the zero line on the daily chart of XAUUSD, for example, during a sustained bull leg tells you the momentum that was already working is reasserting itself. The trade idea is simple: the trend isn't done, this is a re-entry or add opportunity. The risk is that continuation signals can fail at resistance, so confluence with price structure still matters.
MACD bullish crossover below the zero line
A bullish crossover that occurs while both the MACD line and signal line are still below zero is a different animal entirely. Here, the 12 EMA is still below the 26 EMA — bearish territory — but momentum is beginning to shift. The MACD line curling up through the signal line below zero is the first sign that selling pressure is exhausting and buyers are starting to contest control.
This is reversal territory. You're not confirming an existing trend; you're identifying a potential turning point. That distinction changes how you size the trade, where you place your stop, and how much confirmation you want before entry. A clean bullish cross below zero on a compressed histogram — bars shrinking toward zero before the cross — carries more weight than a cross on wide, volatile bars.
Is a MACD crossover below zero a stronger signal?
Often, yes — but with an important caveat. A MACD bullish crossover below the zero line can be a stronger reversal signal precisely because it's catching momentum at the point of maximum pessimism. The crowd is still positioned short, sentiment is bearish, and the crossover is flagging a structural shift before the majority has noticed. When that crossover aligns with a key support level, a volume spike, or a bullish candlestick pattern, the confluence is hard to ignore.
The caveat: below-zero crossovers in a strong downtrend can be false dawns. Price bounces, MACD ticks up, then rolls back over — what looked like a reversal was just a dead-cat correction. This is why reversal traders typically demand more confirmation than trend-followers. Wait for the MACD line to sustain above the signal line across at least one or two closes, or require price to clear a defined resistance level, before committing full size.
Mirror this logic for bearish setups: a bearish crossover above zero in a downtrend is a continuation signal; a bearish crossover below zero is a weaker, potentially exhausted move. The zero line is a dividing line between two distinct trading styles — swing traders who ride trends and reversal traders who hunt turning points. Knowing which side of zero you're on tells you which playbook to reach for.
The RSI + MACD Combined Strategy
Used alone, a MACD crossover tells you momentum is shifting — it doesn't tell you whether price is already stretched. That's exactly what RSI (Relative Strength Index) fills in. These two indicators solve different problems, which is why combining them produces a more complete signal than either delivers on its own.

Why RSI Complements MACD Instead of Duplicating It
RSI is a mean-reversion tool. It measures how far price has moved relative to recent closes and flags when a market is statistically extended — overbought above 70, oversold below 30. MACD is a trend and momentum tool. It measures the distance between two moving averages and flags when that momentum is accelerating or decelerating. One looks at how stretched price is; the other looks at which direction force is building. They operate on different axes, which means a confirmed RSI + MACD trading strategy reduces the noise that either indicator generates when used solo.
The classic false signal that kills MACD-only traders: a bullish crossover fires in a market that's already 80 on RSI. Momentum looks positive, but price is exhausted. The combined signal filters that trade out before you're in it.
Combined Signal Rules Table
The table below maps RSI zone against MACD crossover state and trend context to a clear action. "Trend context" here means the direction of the 50-period EMA on your working timeframe — above it is bullish, below is bearish.
| RSI Zone | MACD State | Trend Context (vs 50 EMA) | Action |
|---|---|---|---|
| Below 30 (oversold) | Bullish crossover | Price above 50 EMA (bullish) | High-conviction long — pullback into oversold in an uptrend |
| Below 30 (oversold) | Bullish crossover | Price below 50 EMA (bearish) | Cautious long or no trade — potential dead-cat bounce in a downtrend |
| 30–50 (neutral, recovering) | Bullish crossover | Price above 50 EMA (bullish) | Long — momentum confirming trend continuation |
| 30–50 (neutral, recovering) | Bearish crossover | Price above 50 EMA (bullish) | No trade — conflicting signals, wait for resolution |
| 50–70 (neutral, extended) | Bullish crossover | Price above 50 EMA (bullish) | Long with tighter stop — trend intact but room to run is shrinking |
| 50–70 (neutral, extended) | Bearish crossover | Price below 50 EMA (bearish) | Short — momentum confirming downtrend continuation |
| Above 70 (overbought) | Bullish crossover | Any | No trade — MACD signal likely exhausted; risk/reward is poor |
| Above 70 (overbought) | Bearish crossover | Price above 50 EMA (bullish) | Tighten stop on longs — possible reversal forming; don't add |
| Above 70 (overbought) | Bearish crossover | Price below 50 EMA (bearish) | High-conviction short — exhaustion confirmed by trend and momentum |
| Any zone | No crossover (MACD flat or diverging) | Any | No trade — wait for a confirmed crossover before acting on RSI alone |
Worked Example: RSI + MACD on Gold
XAUUSD is the most actively traded instrument across For Traders evaluations, and the 4-hour chart is where most of that action gets structured. Here's a setup that appears regularly.
Price has been trending higher for several sessions. A three-day pullback drags RSI down to 35 — below the midline but not extreme. The 50 EMA is still pointing upward and price is sitting just above it, confirming the broader trend is intact. Then, on the 4H close, the MACD line crosses above the signal line from below zero — a bullish crossover in negative territory, the kind that historically marks the end of a corrective leg rather than a trend reversal.
Using the table above: RSI at 35 sits in the 30–50 recovery zone, MACD has just printed a bullish crossover, and price is above the rising 50 EMA. That's a long entry with full conviction. Entry is placed at the open of the next 4H candle. Stop goes 1.5× ATR below the swing low of the pullback — not at the round number that's 10 pips lower, because round numbers on gold attract liquidity hunts. Target is the previous swing high, giving a minimum 2:1 R:R before the trade is considered.
What this setup avoids is equally important: if RSI had been sitting at 72 when that MACD crossover fired, the table says no trade. The combined signal framework keeps you out of the exhaustion entries that look identical on MACD alone but have a fraction of the follow-through.
Ready to trade funded capital?
Choose your path — Instant Accounts, One-Step or Two-Step Challenges — from just $23, with up to $300,000 in funded capital.
Choose your challengeVolume Confirmation: Turning a Signal into a Setup
A MACD crossover without volume behind it is a suggestion, not a signal. Price can drift through the signal line on thin air during low-liquidity sessions and reverse just as quietly — leaving you holding a position that looked textbook clean and behaved like noise. Volume is what separates a genuine momentum shift from a random oscillation in the histogram.
How does high volume confirm a MACD bullish crossover?
When a MACD bullish crossover fires — the MACD line crossing above the signal line — you want to see the volume bar on that candle expand meaningfully relative to the recent average. A practical threshold: the confirmation candle's volume should be at least 1.5× the 20-period average volume. Anything below that and institutional participation is questionable; the move may be retail-driven and fragile.
The logic is straightforward. A crossover happens because the shorter EMA is accelerating faster than the longer one, reflecting a shift in buying pressure. If that buying pressure isn't backed by size — real orders hitting the market — the shift is shallow. Volume confirmation tells you that the momentum the MACD is detecting has actual weight behind it. Watch for the volume spike to coincide with the crossover candle or the one immediately after. A spike that arrives two or three candles late is chasing, not confirming.
Bollinger Bands add a useful volatility layer here. If the bullish crossover fires while price is hugging or breaking back above the lower Bollinger Band, the squeeze-and-expand dynamic suggests the market was coiled and is now releasing energy — not just drifting upward. That combination of crossover, volume expansion, and Bollinger Band context narrows your entries considerably.
Volume rules for forex vs futures vs crypto
Volume isn't the same animal across asset classes, and treating it identically across markets will cost you fills.
- Futures and US indices (US100, ES, NQ): Use actual tick volume and contract volume from the exchange. CME-reported volume is real — every contract traded is counted. A volume spike on an NQ MACD crossover during the New York open is meaningful. The same spike at 2 a.m. CT is not; context matters as much as the number itself.
- Forex (XAUUSD, major pairs): True volume doesn't exist in the decentralised spot market. Tick volume — the number of price changes per period — is the proxy, and it correlates reasonably well with actual market activity. It won't be perfect, but a tick volume spike of 1.5–2× average on a gold MACD crossover is still a meaningful signal. XAUUSD in particular tends to show reliable tick volume spikes around London open and the US equity overlap.
- Crypto: Exchange-reported volume varies by platform, but on liquid pairs (BTC, ETH) the directional signal is trustworthy. Watch for volume spikes that accompany the crossover on the daily or 4H — intraday crypto volume can be noisy enough to mislead on sub-1H charts.
Combining volume with support and resistance
This is where a signal becomes a setup. A MACD bullish crossover with high volume firing in open space — away from any structure — is a lower-conviction entry. The same crossover firing as price bounces off a well-defined support and resistance level is a different trade entirely.
The confluence stack looks like this: price pulls back to a known support zone (a previous swing low, a round number, a weekly VWAP level), the MACD crossover fires on that bounce, and volume expands on the confirmation candle. Add a Bollinger Band lower-band touch and you have four independent signals pointing at the same moment in price. That's not luck — that's the market agreeing with itself.
Structure your entry around the support level: your stop sits below it (not at the round number where stops cluster, but 1–1.5× ATR below the zone), and your target is the next significant resistance. The volume confirmation gives you the confidence to hold through the first pullback that will inevitably test your conviction. Without it, you're guessing. With it, you're executing a setup with defined logic at every decision point.
MACD Crossover vs Moving Average Crossover
The MACD crossover and the moving average crossover are both momentum-detection tools built on EMAs and SMAs — but they measure fundamentally different things, fire at different times, and suit different trading contexts. Knowing which to reach for is half the edge.
What's the difference in signal generation?
A classic moving average crossover — say, the 50 SMA crossing the 200 SMA — fires when two price averages physically cross on the chart. Price has to have moved far enough, for long enough, to drag the slower average through the faster one. That takes time. The so-called Golden Cross and Death Cross are the most cited examples: clean, unambiguous, and by the time they print, the trend has already been running for weeks.
The MACD crossover works one layer deeper. The MACD line is the distance between the 12-EMA and 26-EMA — momentum itself, not price. When that line crosses the 9-period signal line, you're not waiting for price averages to converge; you're watching the rate of change of that distance shift direction. The MACD histogram makes this visible in real time: bars shrinking toward zero before the crossover even happens. That compression is the early warning. By the time the bars flip negative, the crossover has already occurred — you can often anticipate it by two or three candles.
In practical terms: on a daily EUR/USD chart, a MACD crossover might fire three to five days before the 50/200 SMA crossover confirms the same move. That gap is opportunity — or rope to hang yourself with, depending on how you manage it.
Which is faster, which is more reliable?
MACD is faster. MA crossovers are more reliable on larger timeframes. That's not a contradiction — it's a function of what each tool is optimised for.
MACD's speed comes at a cost: on choppy, range-bound markets, the signal line and MACD line whipsaw constantly, generating false crossovers that look identical to the real thing. A trend-following strategy built purely on MACD crossovers in a sideways market will bleed you slowly. MA crossovers, by contrast, require sustained directional movement before they fire — which means fewer signals, but each one carries more weight behind it.
| Feature | MACD Crossover | MA Crossover (50/200 SMA) |
|---|---|---|
| Signal frequency | High (multiple per month on daily charts) | Low (1–4 per year on daily charts) |
| Lag from move onset | Low–moderate (3–7 candles) | High (weeks on daily; months on weekly) |
| False-signal rate | Higher — especially in ranging markets | Lower — filters out most noise |
| Best market condition | Trending with momentum bursts | Established, sustained macro trends |
| Typical use case | Entries, momentum timing, intraday | Trend confirmation, position bias, swing |
When to use each
Use the MACD crossover when you need timing precision inside a trend you've already identified. If XAUUSD is in a clear uptrend on the daily and you're hunting for a long entry on the 4H, a bullish MACD crossover with a rising histogram gives you a defined trigger point. You're not calling the trend — you already know it. You're using MACD to find your entry within it.
Use the MA crossover when you need directional conviction on a higher timeframe — to set your bias for the week, or to confirm that a macro trend is real and not just a short-term spike. A 50/200 SMA crossover on the weekly chart of US100 tells you something meaningful about institutional positioning. It's not a trade signal in isolation; it's a filter that keeps you on the right side of the dominant trend.
The most robust trend-following strategy combines both: MA crossover sets the directional bias, MACD crossover times the entry. You get the reliability of the slower tool and the precision of the faster one — without relying on either alone.
The 4-Hour MACD Crossover Workflow
The 4-hour timeframe is where most serious prop traders do their real work — it filters out the intraday noise that kills evaluation accounts while still delivering three to five actionable setups per week. Pair it with a top-down multi-timeframe structure and a MACD crossover strategy becomes genuinely systematic rather than reactive.

Why the 4H Timeframe Is a Sweet Spot for Prop Traders
Evaluation accounts punish two things above all else: overtrading and wide stops. The 4H chart addresses both. Each candle represents four hours of price discovery, which means the MACD histogram has enough data to reflect genuine momentum shifts — not just a five-minute spike off a news headline. Compared to the daily chart, which might give you one setup per week, the 4H gives you enough frequency to build a track record across a 30-day evaluation window without forcing trades.
For instruments like XAUUSD and US100 — the two most-traded assets across For Traders evaluations — the 4H also captures the overlap between London and New York sessions, where volume and directional conviction tend to be highest. That's where crossovers carry the most weight.
Recommended MACD settings by timeframe:
- Daily: Standard 12/26/9 — used for bias only, not entries
- 4H: Standard 12/26/9 — primary trigger timeframe
- 1H: 8/21/5 — faster settings for refined entry timing
Multi-Timeframe Alignment: Daily → 4H → 1H
The workflow runs top-down. Each timeframe has a single job, and you don't move to the next until the higher one gives you clearance.
- Daily chart — establish directional bias. Is the MACD line above or below zero? Is price above the 50-day EMA? You're not looking for a crossover here; you're asking a simple question: what direction does the dominant trend favour? If the daily MACD is above zero and trending, you're only interested in 4H bullish crossovers — full stop.
- 4H chart — wait for the MACD crossover trigger. A 4-hour MACD bullish crossover, confirmed by the histogram flipping from negative to positive bars, is your setup trigger. The crossover must align with the daily bias — if the daily is bearish, a 4H bullish crossover is a counter-trend signal and you skip it.
- 1H chart — refine the entry. Drop to the 1H using the faster 8/21/5 MACD settings. Wait for the 1H to confirm momentum in the same direction — a bullish crossover on the 1H after the 4H has already triggered means you're entering with three timeframes aligned. This is where you place your limit or market order.
Worked Example on US100
Imagine US100 in a clear uptrend: price is above the 50-day EMA, and the daily MACD line has been above zero for two weeks. A pullback develops over two days, pushing the 4H MACD below its signal line. Then, early in the London–New York overlap, the 4H MACD line crosses back above the signal line — a 4-hour MACD bullish crossover — with the histogram printing its first positive bar. Bias confirmed. Setup triggered.
You drop to the 1H. The 8/21/5 MACD crossover fires twenty minutes later as price bounces off a prior 4H support level near 19,840. That's your entry.
- Entry: 19,845 (market order on 1H crossover confirmation)
- Stop: 1.5× 4H ATR below the entry candle's low — ATR at 85 points means stop at approximately 19,717, below the pullback structure
- Target: 2R minimum, targeting the prior swing high at 20,015 — roughly 170 points of potential reward against an 85-point stop
The stop is ATR-based, not placed at a round number. Round numbers like 19,700 or 19,750 are where algorithms hunt liquidity — your stop sitting there is a gift to the market. Place it where the thesis is genuinely invalidated: below the pullback low, sized by volatility, not convenience.
Multi-timeframe analysis doesn't make the MACD crossover strategy perfect — no edge is. What it does is stack the conditions in your favour before you risk a single tick of your evaluation account's drawdown allowance.
Filtering False Signals in Ranging Markets
MACD is a trend-following indicator built on exponential moving averages — in a ranging market, it will fire crossovers almost continuously, and the majority of them will be noise. The single most protective rule you can apply: do not take MACD crossover trades in a confirmed range.
Why MACD Lies in Sideways Price Action
The MACD line measures the distance between a 12-period and 26-period EMA. When price is trending, that gap expands and contracts with conviction. When price is chopping between horizontal support and resistance, both EMAs compress toward each other and the MACD line oscillates around zero with no real momentum behind it — the crossovers come fast, alternate direction, and each one looks as valid as the last.
The MACD histogram makes this visible. In a genuine trend, histogram bars grow progressively in one direction before a crossover. In a range, you'll see short, choppy bars that flip colour every few candles — momentum building to nothing. If the histogram has been printing alternating red and green bars for ten or more periods, you're in chop. Walk away.
You've probably felt this: you take what looks like a clean bullish crossover, price moves three or four pips in your favour, then reverses straight through your entry and triggers your stop. Then it reverses again. That's the range tax — and MACD collects it efficiently.
The ADX Filter and Other Range-Detection Tools
The Average Directional Index (ADX) is the most direct tool for quantifying trend strength. A reading below 20 indicates a market without directional conviction — the textbook definition of a range. Above 25, trend momentum is present; above 30, it's strong. The rule is simple: if ADX is below 20, MACD crossover signals are disqualified, regardless of how clean they look on the chart.
Complement ADX with a visual check: is price bouncing predictably between two horizontal levels you can draw with a ruler? Are the swing highs roughly equal? Are the swing lows roughly equal? If yes, you're ranging. No MACD crossover trade. Wait for a breakout with volume expansion, let price retest the broken level, then look for your crossover in the new trend.
Bollinger Band width is a secondary filter worth adding. Bands that have been contracting for multiple sessions signal compressed volatility — a range. When they begin expanding, the market is waking up and MACD signals become more trustworthy again.
Using MACD Divergence as a Confirmation Layer
When a crossover does appear, MACD divergence is the highest-quality confirmation layer available. Bullish divergence occurs when price makes a lower low but the MACD histogram or MACD line makes a higher low — momentum is not confirming the new price low, which signals exhaustion in the sellers. Bearish divergence is the mirror: price makes a higher high, MACD makes a lower high.
Divergence doesn't replace the crossover — it validates it. A bullish crossover accompanied by bullish divergence is a materially different signal from a crossover firing in flat price action with no divergence present.
Use this checklist before acting on any MACD crossover:
- ADX above 20 — trend strength is present
- Price is not range-bound — no clear equal highs / equal lows structure
- MACD histogram momentum is building — bars growing in the crossover direction before the signal fires
- Higher-timeframe trend aligns — crossover direction matches the daily or weekly bias
- Divergence present — not mandatory, but when it's there, conviction increases meaningfully
- No major news event within 30 minutes — FOMC, NFP, and CPI releases manufacture false crossovers through volatility spikes
False signal filtering is not about being selective to the point of paralysis. It's about recognising that MACD crossover momentum is meaningful only when a market is actually moving somewhere — and in ranging markets, it isn't.
Backtesting the Strategy on a Simulated Account
You cannot trust a strategy you haven't measured. A MACD crossover setup that feels right across three memorable winners is not a strategy — it's a highlight reel. Backtesting across 100 or more historical setups, logged systematically, is what separates a tradeable edge from a story you tell yourself.
Why Backtesting Beats Intuition
Human memory is a terrible trade journal. It overweights the wins and softens the losses, which means your gut-feel win rate on any setup is almost certainly inflated. When you sit down and manually backtest MACD crossover signals — combined with RSI confirmation and volume context — across different market conditions, you often discover something uncomfortable: the setup that felt like a 65% winner is running closer to 48% in ranging conditions, while it genuinely hits 60%+ in a trending environment. That distinction is only visible in the data.
What you're building through backtesting is a conditional edge — understanding not just whether the setup works, but when it works and when it doesn't. Track your results segmented by market condition: trending, ranging, and high-volatility news-driven sessions. You'll likely find, as most systematic traders do, that MACD crossover signals in trending markets carry meaningfully better R:R than the same signal fired during a choppy consolidation.
How to Log Crossover Trades Systematically
Manual backtesting on a 100-trade sample doesn't need to be complicated, but it does need to be consistent. For each historical crossover setup, log the following before you record the outcome:
- Entry trigger: MACD line crossing signal line, above or below zero line
- Confirmation: RSI reading at entry (above 50 for longs, below 50 for shorts) and whether volume supported the move
- Stop placement: distance in ATR from entry to stop
- Target and actual R:R achieved
- Market condition: trending, ranging, or pre/post news
- Outcome: win, loss, or breakeven — and maximum adverse excursion before outcome
After 100 logged setups, you have something real: a win rate, an average R:R, a drawdown curve, and a breakdown by condition. That's the foundation for a position-sizing model. Without it, you're guessing at lot sizes and hoping the equity curve trends upward.
Using a Prop Trading Challenge as Your Live-Fire Test
Backtesting tells you what would have happened. Forward testing on a simulated account tells you what happens when you're actually pulling the trigger in real time, with real spreads, real execution speed, and real emotional pressure on every fill.
A prop trading challenge with For Traders functions as exactly that bridge — between the clean data of a backtest and the messy reality of live execution. The environment runs on real market data with genuine execution feel, but your capital at risk is simulated. More importantly, the defined risk parameters built into every challenge — daily loss limits and maximum drawdown thresholds — force you to apply the same discipline your backtesting assumed you had. You can't let a losing MACD trade run past your stop and pretend the test is still valid. The structure won't allow it.
That constraint is the point. Demo trading without defined rules teaches you nothing about discipline under pressure. A structured challenge with hard limits replicates the conditions your backtested strategy actually assumed — and shows you, quickly, whether your execution matches your edge. Think of it as the final exam between your backtested hypothesis and a funded account.
Ready to trade funded capital?
Choose your path — Instant Accounts, One-Step or Two-Step Challenges — from just $23, with up to $300,000 in funded capital.
Choose your challengeMACD Crossover Strategy: Pros and Cons
Pros
- Simple, visual signal that works across every asset class and timeframe
- Combines trend and momentum in a single indicator
- Well-documented, well-backtested — over 40 years of trader use
- Pairs cleanly with RSI, volume, and price structure for confluence
- Below-zero bullish and above-zero bearish crossovers catch reversals early
Cons / risks
- Generates frequent false signals in ranging or low-volatility markets
- Lagging by nature — you're always trading after the momentum shift begins
- Default settings (12, 26, 9) aren't optimal for every timeframe or asset
- Without filters (RSI, volume, MTF alignment), win rate drops sharply
- Divergence signals require experience to read — they're not mechanical
Frequently Asked Questions
What is a MACD crossover and how does it work?+
A MACD crossover occurs when the MACD line (12-period EMA minus 26-period EMA) crosses above or below the 9-period signal line, generating a buy or sell signal. When the MACD line crosses above the signal line, it's bullish; below is bearish. The histogram — the visual gap between the two lines — shrinks to zero at the crossover point, then expands in the new direction. Momentum is shifting at that exact moment, which is why traders watch it closely across forex, gold, and indices.
What does a bullish MACD crossover signal mean?+
A bullish MACD crossover means the MACD line has crossed above the signal line, indicating that short-term momentum is accelerating faster than the longer-term average — a potential entry signal for longs. The signal carries more weight when it forms below the zero line (histogram territory is negative), because price is recovering from genuine bearish pressure rather than just a shallow pullback. Combine it with a higher-low structure on price and the crossover becomes a meaningful confluence, not just a lagging indicator firing late.
Why is a MACD bullish crossover below the zero line stronger?+
A bullish crossover below the zero line signals that momentum is reversing from deeply oversold territory, which historically precedes larger moves than crossovers that happen above zero. Above zero, the MACD is already in bullish territory — a crossover there often just confirms continuation of a trend already in progress. Below zero, you're catching a potential trend reversal early. On XAUUSD and US indices, these sub-zero crossovers frequently align with key support zones, making them high-probability setups when volume and price structure agree.
What does a bearish MACD crossover mean in an uptrend?+
A bearish MACD crossover inside an uptrend — where the MACD line drops below the signal line while both are still above zero — typically signals a momentum slowdown or a corrective pullback, not necessarily a full trend reversal. Shorting into a strong uptrend on this signal alone gets traders killed. The smarter read is to use it as a warning to tighten stops or reduce position size. A bearish crossover that forms above the zero line and then drops through it is a far more serious reversal signal worth acting on.
How does high volume confirm a MACD bullish crossover?+
Volume expanding at the moment of a MACD bullish crossover confirms that real buying pressure is behind the momentum shift, not just low-liquidity noise. A crossover on thin volume — common during Asian session gold trading or pre-market index moves — has a much higher false-positive rate. When volume spikes alongside the crossover, especially near a key support level or after a news catalyst like NFP or FOMC, the signal has institutional weight behind it. No volume confirmation means treat the crossover as a watch signal, not an immediate entry.
How do RSI and MACD work together in one strategy?+
Combining RSI and MACD filters out a large share of false crossover signals by requiring both indicators to align before entry. The setup: wait for a MACD bullish crossover, then confirm RSI is above 50 (or rising from below 30 for reversal trades) before pulling the trigger. If MACD crosses bullish but RSI is overbought above 70, skip it — momentum is already stretched. On the 4-hour chart for XAUUSD or US100, this dual-confirmation approach dramatically reduces whipsaw entries compared to trading MACD crossovers in isolation.
What is the difference between a moving average crossover and MACD crossover?+
A moving average crossover — like a 50 EMA crossing a 200 EMA — plots directly on price and signals trend direction over longer periods. A MACD crossover is derived from the difference between two EMAs and plotted as a separate oscillator, making it more sensitive to short-term momentum shifts. The MA crossover tells you where trend stands; the MACD crossover tells you when momentum is accelerating or fading within that trend. Used together, the MA crossover defines your bias and the MACD crossover times your entry — two different jobs, both necessary.
How do you filter false MACD crossovers in ranging markets?+
In ranging markets, MACD crossovers fire constantly and most of them fail — price chops through the signal line repeatedly without follow-through. The fix is to add a trend filter before trusting any crossover: ADX below 20 means the market is ranging, so ignore MACD signals entirely. Alternatively, only trade crossovers that form near the outer edges of the range (near support or resistance), not in the middle. On gold and forex pairs during low-volatility sessions, waiting for ADX confirmation saves you from death by a thousand small losses.
What MACD settings work best on different timeframes?+
The default 12-26-9 settings work well on the 4-hour and daily timeframes for swing trading gold, forex, and indices. Scalpers on the 5- or 15-minute chart often tighten settings to 5-13-5 or 8-17-9 to make the indicator more responsive, accepting more false signals in exchange for earlier entries. Position traders on the weekly chart sometimes widen to 19-39-9 to filter noise. There's no universally 'best' setting — the right choice depends on your holding period and how many signals you want to evaluate per session.
How do you backtest a MACD crossover strategy on a challenge account?+
Start by manually backtesting on historical charts — scroll back 200-300 candles on your chosen timeframe and mark every MACD crossover, then record what price did next. Log win rate, average R:R, and how many signals fired in trending versus ranging conditions. Once you have a rule set that holds up historically, paper-trade it forward on a demo account or a For Traders challenge account using simulated capital — no real money at risk while you stress-test entries, stops, and position sizing under realistic conditions before committing to a live evaluation.
Written by
Marcel Hambálek
Senior Trader, For Traders
Marcel trades Futures and Forex day-trading setups on funded accounts and writes about the executional details most traders skip — order types, slippage, session timing, platform quirks on MT5 and NinjaTrader. Pragmatic, mechanics-first, no fluff.
Follow on LinkedInReady to trade funded capital?
Choose your path — Instant Accounts, One-Step or Two-Step Challenges — from just $49, with up to $300,000 in funded capital.
Choose your challengeRelated Blog Posts
Trade up to $300,000
Choose challenge