Trending vs Ranging Markets: Key Differences
A ranging market moves sideways between horizontal support and resistance. Learn the exact ADX, ATR and structure thresholds to spot range vs trend in 30 seconds.
By Jakub Rož · Founder & CEO, For Traders
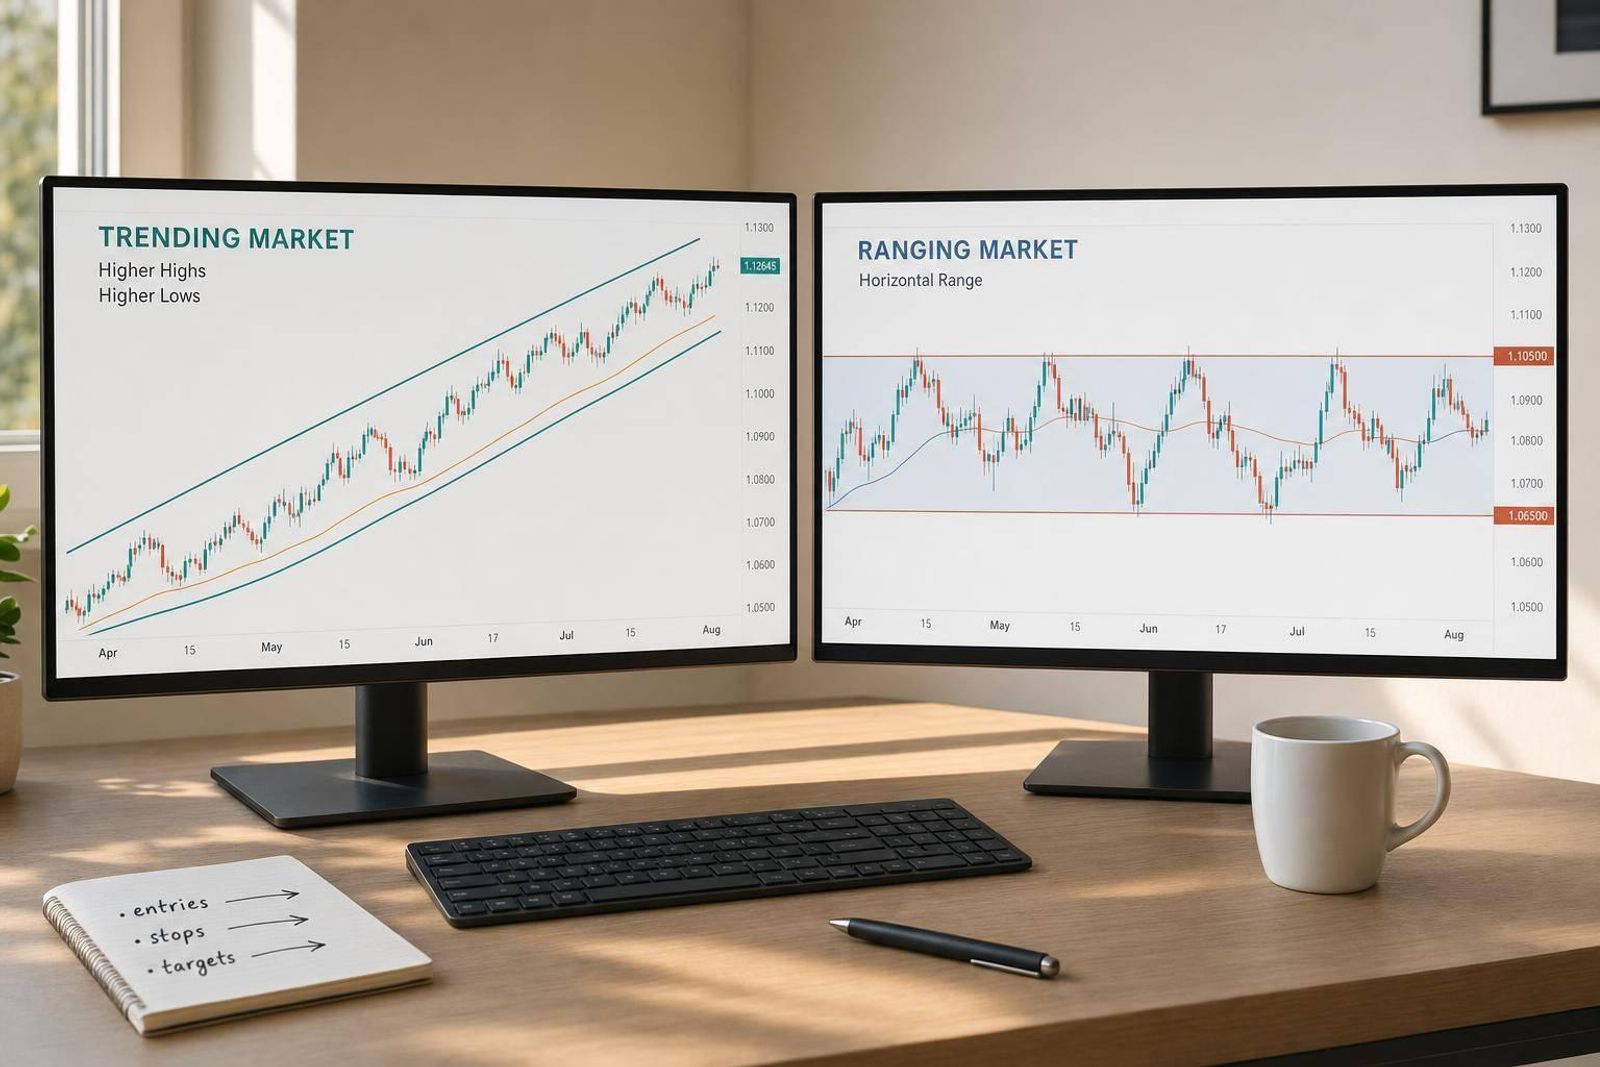
A ranging market is a market moving sideways between a horizontal support floor and a horizontal resistance ceiling, with no series of higher highs or lower lows — price repeatedly reverses at the boundaries instead of continuing through them. A trending market is the opposite: price makes higher highs and higher lows (uptrend) or lower highs and lower lows (downtrend), so levels break and flip rather than hold.
Key takeaways
- Range = reversals at the edges; trend = continuation through the edges — the same level does a different job in each regime.
- ADX above 25 with expanding ATR says trending; ADX below 20 with contracting ATR says ranging — between 20 and 25 is no-man's-land, so size down.
- A true range needs at least three touches of a boundary and a respected midpoint; two touches is a pullback, not a range.
- Oscillators (RSI, Stochastics) are reliable inside a range and lie to you in a trend; moving averages and trailing stops do the reverse.
- FX majors compress in the Asian session, gold coils tight then expands violently, and US100 trends in RTH but ranges overnight — regime is instrument- and session-specific.
- On a prop evaluation, chop is what quietly drains a daily loss limit — cut size when the regime is unclear rather than trading the same setup everywhere.
Watch: related video
What Is a Ranging Market? (And What Is a Trending Market?)
A ranging market is price moving sideways between a horizontal support floor and a horizontal resistance ceiling, with no series of higher highs or lower lows — every rally and every dip gets sold or bought back to the same zone. A trending market is the opposite: price makes higher highs and higher lows in an uptrend, or lower highs and lower lows in a downtrend, so each leg builds on the last instead of returning to it.
Ranging market definition
The ranging market meaning comes down to one thing: rejection. Price tests a resistance zone, gets turned back, drifts down to support, gets bought back up — and repeats. There's no directional bias inside the box. A range-bound market can hold for hours on a lower timeframe or for weeks on daily charts (gold spent much of a recent quarter chopping between two clean levels before it broke). The defining feature isn't the size of the box — it's that both boundaries hold on repeated tests.
Trending market definition
Trending market meaning is structural, not visual. You're not looking for a pretty diagonal line — you're counting swing points. Higher highs and higher lows confirm an uptrend; lower highs and lower lows confirm a downtrend. The moment that sequence breaks — a lower high forms in what was an uptrend — the trend is, at minimum, paused. This is why traders lean on swing structure over moving averages alone: an indicator can lag the actual break in sequence by several candles.
What does 'ranging' mean in trading?
Here's the part traders get wrong early on: ranging isn't a pattern you spot on a chart and it isn't a single indicator reading like an RSI print. It's a market regime — a description of how price is currently behaving across an entire session or swing, not a one-candle signal. You confirm it by watching support and resistance zones hold on at least two touches each, not by one bounce.
Why the distinction decides your entire trade plan
Regime is the first decision you make before you even look at entries, because it flips your entire playbook. In a range, you fade the edges — sell resistance, buy support, target the opposite boundary. In a trend, you do the opposite: you follow breaks and buy pullbacks to structure, because fading a trending market into strength is how accounts bleed out slowly.
Same level, different job. In a range, resistance is a wall — price hits it and reverses, every time, until it doesn't. In a trend, that same resistance eventually breaks, and on the retest it flips to support — the old ceiling becomes the new floor. Mistake one regime for the other and you'll fade a breakout that was never going to reverse, or you'll wait for a pullback that never comes because the "trend" was actually a range about to snap the other way.
The 30-Second Regime Check You Can Run Before Every Session
Run this five-step regime filter on the Daily and 4H before you touch your execution chart — it takes less time than your coffee cools and it stops you from trading a breakout strategy into chop, or a mean-reversion strategy into a freight train.
Step 1: Read the swing structure on the higher timeframe
Mark the last four to six swing highs and lows on the Daily. Higher highs and higher lows (or the mirror in a downtrend) means you're looking at trend structure. Swings that keep landing near the same two horizontal levels — no progression — means you're in a ranging market. This is your baseline before any indicator confirms or denies it.
Step 2: Check ADX — above 25, below 20, and the dead zone between
ADX (Average Directional Index) measures how strong a trend is — not which direction price is moving, just how forcefully. Read it on the Daily with a standard 14-period setting.
- ADX above 25 and rising — trending regime, momentum strategies get priority.
- ADX below 20 — ranging regime, mean-reversion setups at the boundaries make more sense.
- ADX between 20 and 25 — undefined. This is the zone where most bad trades happen because the trader forces a label on a market that hasn't decided. Halve your size or stand aside until it resolves one way.
Step 3: Check whether ATR is expanding or contracting
ATR (Average True Range) is the average candle range over a lookback period — a volatility proxy, not a direction signal. Compare current ATR to its own 20-period average. ATR contracting over the last 10-20 bars supports a range holding — volatility is compressing, boundaries are more likely to keep containing price. ATR pushing above its 20-period average supports expansion — a breakout attempt has real force behind it, not just a wick that fades back.
Step 4: Measure range width against ATR
Take the distance between your range's ceiling and floor and divide it by current ATR. If that ratio is below 3-4x, you don't have a tradeable range — you have chop, and the stop-to-target math won't work no matter how clean the boundaries look on the chart. A range needs enough room between the walls to let a mean-reversion trade breathe past normal noise.
Step 5: Count the boundary touches
A level isn't support or resistance until price has respected it at least three times. Two touches could be coincidence. Three touches with clean reversals is a level the market is actually reacting to — that's your three-touch boundary rule, and it's the difference between trading a real range and drawing lines on noise.
| Signal | Trending reading | Ranging reading | Undefined / caution |
|---|---|---|---|
| ADX (14, Daily) | Above 25, rising slope | Below 20 | 20-25 — halve size or wait |
| ATR vs 20-period avg | Expanding, above average | Contracting, below average | Flat / no clear slope |
| Range width vs ATR | N/A | At least 3-4x ATR | Below 3x ATR = chop, not range |
| Boundary touches | Level breaks on approach | 3+ clean reversals | Fewer than 3 — level unproven |
Run all five and you'll rarely be wrong about the regime you're in — and knowing the regime before you pick a strategy is the actual edge here, not the strategy itself.
True Range vs Trend Pullback vs Consolidation: The Test Most Traders Skip
A true range needs three touches on a boundary and a midpoint price keeps crossing; a trend pullback only has two touches with structure still intact; a consolidation flag drifts sideways but stays on one side of the box. Mixing these up is where the money actually goes — you fade a level that was never a level, or you wait for a reversion that a bull flag was never going to give you.
The three-touch boundary rule
One bounce off a level is noise. Two is interesting. Three clean reversals off the same horizontal — with wicks rejecting and closes staying inside — is what turns a line on your chart into an actual boundary. This is the same logic a Donchian channel is built on: it plots the highest high and lowest low over N periods, and the more times price respects those extremes without breaking them, the more the channel behaves like a real range bound market strategy setup instead of a random cluster of candles. If you can only count two touches on either side, you don't have a range yet — you have a level that hasn't been tested enough to trade against.
Is the midpoint being respected?
This is the test most traders skip entirely. In a true range, the midpoint isn't just geometry — it's a magnet. Price should cross it, stall, cross back, and use it as a pivot multiple times across the structure. That back-and-forth is what confirms two-way order flow. In a trend pullback or a consolidation flag, price hugs one side of the box and rarely touches, let alone crosses, the mid. If the midpoint of your "range" has been touched once in the last twenty bars, you're not looking at a range — you're looking at one side of a larger structure that hasn't finished forming.
How a pullback fakes a range (and how to unmask it)
A trend pullback shows up looking like the start of a range: price stalls, chops for a few bars, maybe taps a level twice. The tell is structure. In an intact uptrend, a pullback still holds higher lows on the smaller timeframe even while it "ranges" on yours — it's counter-directional but temporary, not two-way. Count the touches: two is standard for a pullback, three-plus with midpoint crossing is range behavior. If you only get two touches before the level breaks and continues, that's sideways market trading data telling you it was a pullback all along, not a genuine consolidation vs range setup.
Continuation flags: sideways but not ranging
A bull flag chops sideways too, but it drifts against the prior impulse with contracting range, and — critically — the impulse leg that preceded it is still unretraced. That's your decision line: if the last impulse leg is more than 2× the height of the sideways structure, treat it as continuation, not a range. A shallow, tightening box after a strong leg is the market catching its breath, not reversing. Trade it like a range and you'll get run over when it resolves — because it never was one.
Trending vs Ranging Markets: Side-by-Side Comparison
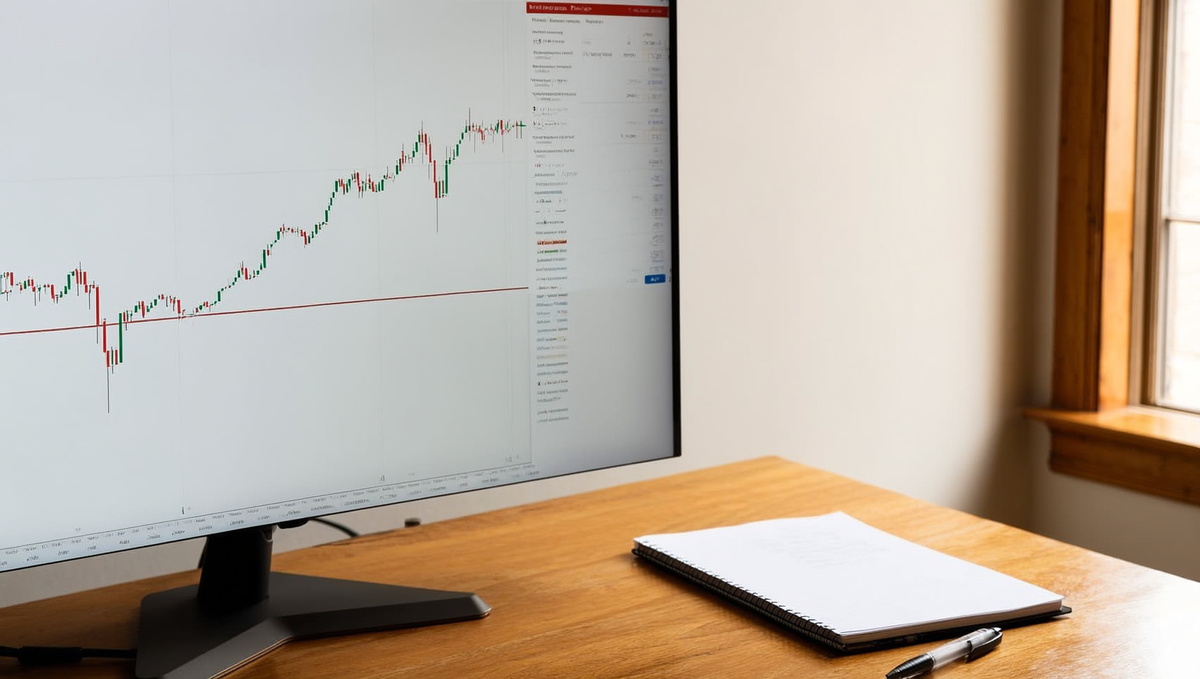
The short version: trend versus range market regimes come down to one question — does price accept the level or reject it? In a ranging market you fade the edges and expect mean reversion; in a trending market you buy the pullback and ride momentum. Mix up the playbook and you'll fade a breakout or buy a pullback that turns into a full reversal — both account blowers.
- Trend = continuation. Range = reversal at the boundary.
- Trend tools = 20 EMA, 50 EMA, ADX, ATR. Range tools = horizontal S/R zones, RSI, Stochastics, Bollinger Bands.
- Trend stops trail behind price. Range stops sit fixed just past the boundary.
Structure, levels and bias
A ranging market prints a horizontal floor and ceiling — no higher highs, no lower lows, just a rejection at the same two zones over and over. A trending market breaks those levels and flips them: yesterday's resistance becomes today's support. Bias in a range is neutral — you're betting on the box holding. Bias in a trend is directional — you're betting the last swing wasn't the last one.
Entries: fade the edge vs buy the pullback
In mean reversion mode, you fade the edge — short into resistance, buy into support, always with confirmation (a rejection wick, RSI divergence, a Stochastics cross out of overbought). In momentum mode, you buy the pullback into the 20 EMA or 50 EMA and let the trend do the work. Fading a genuine trend and buying a pullback in a dead range are the two most common ways traders on the platform blow through their daily loss limit.
Stops and targets: fixed vs trailing
Range trades use a fixed target — the opposite boundary or the midpoint — with a stop just beyond the zone you're fading. Trend trades use a trailing stop beyond the last swing low or high, because the whole point is to let a winner run past any fixed number. Trailing stop vs fixed target isn't a preference, it's dictated by the regime.
Position size and expected hit rate
Range trades tend to have a higher win rate but smaller R:R, typically 1:1 to 1:1.5 — you're taking quick, high-frequency reversals off well-defined levels. Trend trades have a lower hit rate but bigger R:R, often 1:2 or beyond, since a handful of runners cover a string of small losses. Size accordingly: tighter stops in a range let you hold slightly larger size for the same dollar risk; wider trend stops usually mean smaller size per trade.
| Factor | Trending Market | Ranging Market |
|---|---|---|
| Price structure | Higher highs/lows or lower highs/lows | Horizontal floor and ceiling |
| Dominant behaviour | Continuation | Reversal at boundary |
| Key levels | Dynamic MAs (20/50 EMA) | Horizontal S/R zones |
| Best-fit indicators | 20/50 EMA, ADX, ATR | RSI, Stochastics, Bollinger Bands |
| Entry logic | Buy the pullback to the EMA | Fade the boundary with confirmation |
| Stop placement | Beyond last swing | Just beyond the boundary |
| Target logic | Trailing stop, let it run | Fixed target at opposite boundary/midpoint |
| Typical R:R | 1:2 or better | 1:1 to 1:1.5 |
| Win-rate profile | Lower hit rate, larger R | Higher hit rate, smaller R |
Which Indicators Work in a Range — and Which Ones Lie to You in a Trend
Short answer: RSI, Stochastics, and Bollinger Bands are built for ranges — they measure how stretched price is from a mean, which only means something when price actually returns to that mean. In a trend, those same readings lie to you for bars at a time while ADX and ATR quietly tell you which toolkit you should have opened in the first place.
RSI and Stochastics: reliable at the edges, useless in an impulse
RSI (Relative Strength Index — a momentum oscillator scaled 0–100) is genuinely useful in a ranging market: overbought above 70 near resistance and oversold below 30 near support are decent fade signals when the range is respected. The failure mode is specific — in a strong trend, RSI can print above 70 and simply stay there for fifteen or twenty bars while price keeps climbing. Traders who fade "overbought" in a trend aren't reading a reversal signal, they're reading strength, and that's how accounts bleed one small loss at a time. Stochastic Oscillator (a faster momentum reading comparing close to the recent high-low range) does the same thing, only quicker — it pins at extremes even faster in an impulse leg, so it lies to you sooner and more often than RSI does.
Bollinger Bands: the squeeze that precedes expansion
Bollinger Bands (a moving average with volatility-based upper/lower bands) aren't a directional tool at all — they're a volatility map. When band width contracts to a multi-week low, that's a classic range signature: energy is compressing. It's also a warning that expansion is coming. What it does not tell you is which way. A Bollinger Bands squeeze followed by a breakout can go either direction, so the squeeze is a heads-up to tighten risk and watch the boundary, not a trade signal on its own.
20 EMA and 50 EMA: dynamic support in trend, noise in chop
The 20 EMA and 50 EMA (exponential moving averages weighting recent price more heavily) work beautifully as dynamic support/resistance in a trend — price pulls back to the 20 EMA, holds, and continues. Inside a range, the same averages get crossed and re-crossed constantly, because sideways price is by definition oscillating around its own mean. Every crossover looks like a signal and almost none of them are — that's the textbook whipsaw that drains an account trading mean-reversion tools in the wrong regime.
ADX and ATR as regime filters, not entry signals
ADX (Average Directional Index, 0–100, measures trend strength regardless of direction) and ATR (Average True Range, measures volatility per bar in price terms) don't generate entries. Their job is to tell you which toolkit you're allowed to open. ADX above roughly 25 says trend-following tools are in play; below 20, lean on range tools.
| Reading | Regime signal | Toolkit to open |
|---|---|---|
| ADX < 20 | No directional conviction | RSI, Stochastics, Bollinger Bands |
| ADX > 25 and rising | Trend developing | 20 EMA / 50 EMA pullback entries |
| ATR contracting | Range compressing, breakout risk building | Reduce size, widen stops before expansion |
| ATR expanding | Trend or breakout underway | Trail stops, avoid fading momentum |
The practical rule: one indicator set per regime, switched deliberately, never both running on the same chart fighting each other. Check ADX and ATR first, decide the regime, then pick RSI/Stochastics/Bollinger Bands or EMA pullbacks — not both at once.
Ready to trade funded capital?
Choose your path — Instant Accounts, One-Step or Two-Step Challenges — from just $23, with up to $300,000 in funded capital.
Choose your challengeRanging Market in Forex, Gold and Indices: Sessions Change Everything
A ranging market isn't a fixed label on a symbol — it's a window in time. The same EURUSD chart can be dead-flat at 3am London and trending hard three hours later. If you're trading a ranging market in forex without checking what session you're in, you're fading moves that are about to become the day's real trend.
The Asian session range and the pre-London coil
Tokyo trading hours on EURUSD and GBPUSD are thin — banks are light, order flow dries up, and price compresses into a narrow Asian session range. That range often holds and extends into the pre-London range, the tightest coil of the day, sitting right before the London open. It's tempting to fade the edges of that box. The problem: this compression is frequently just the London desks loading positions before running stops through the Asian high or low to trigger liquidity, then reversing hard the other way. The range you were fading becomes the base of the actual move.
Why FX majors range more than they trend
Major pairs spend a disproportionate share of the week inside a range — no fresh catalyst, no scheduled event, just two-way flow between banks. Trending legs cluster around London/NY overlap and scheduled data. Outside those windows, mean-reversion tools do the heavy lifting; range strategies built around the Asian box and pre-London coil are working with the market's actual rhythm, not against it.
XAUUSD: tight coils, violent expansion
Gold is the single most-traded instrument on the For Traders platform, and its behavior explains why. XAUUSD range compression can sit for hours inside a band far narrower than its own average daily range — then expand through both boundaries within minutes on a headline, a yield move, or a dollar spike. A tight range-fade stop that felt safe an hour ago gets run over instantly. Gold punishes anyone treating its coils like a forex range: size down, or widen the stop before the squeeze, not after.
US100: RTH trend, overnight drift
US indices are the second-biggest cluster on the platform, and US100 shows the clearest session split of any instrument here. During RTH (regular trading hours), it trends — momentum, follow-through, higher highs holding. Overnight, it drifts sideways in low volume. US100 ranging overnight and US100 trending in the cash session are two different rule sets on one symbol; running a single strategy across both sessions is why traders get chopped.
NFP, FOMC and the scheduled regime break
NFP volatility and FOMC volatility aren't surprises — they're pre-announced regime breaks. A range that held all week on EURUSD or gold can die in a single candle when the print lands. Flatten size or step aside going into these; don't fade a range through a scheduled catalyst.
| Instrument | Typical range window | Typical trend/expansion trigger |
|---|---|---|
| EURUSD / GBPUSD | Asian session, pre-London coil | London open stop run, NFP |
| XAUUSD | Coils under average daily range | Sudden expansion, headlines, FOMC |
| US100 | Overnight drift | US RTH trend leg |
Why Range Breakouts Fail — and the Filter That Catches Fakeouts
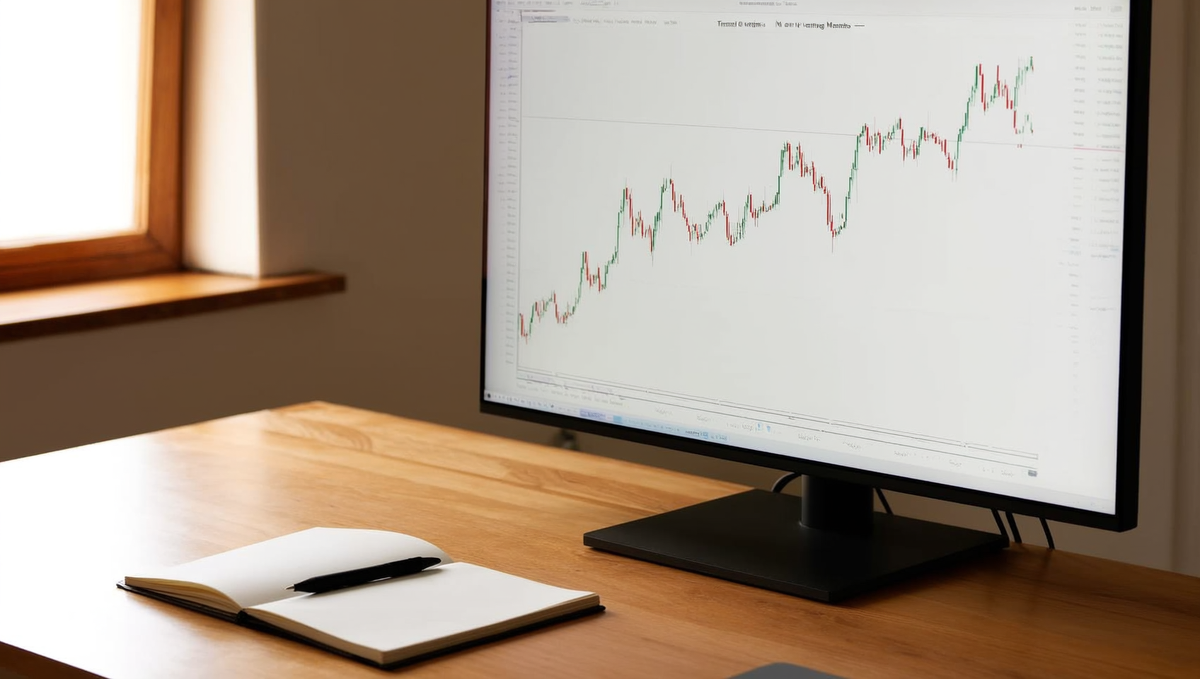
Most breaks out of a mature range fail because the move is a liquidity grab of the stops sitting just beyond the boundary, not the start of a new leg. Price pokes through, triggers the resting orders, and snaps back inside within a bar or two — a false breakout that traps everyone who chased it. The fix isn't avoiding breakouts altogether; it's demanding breakout confirmation before you commit size.
The anatomy of a false breakout
A fakeout has a signature: a long wick pokes past support or resistance, volume or range on that bar is unremarkable, and the very next candle closes back inside the range. The stops beyond the level get swept, market makers and larger players fill against that liquidity, and price reverses. This is exactly the same mechanism you'd fade during Asian-session coils in EURUSD — the level gets tested to harvest orders, not broken to start a trend.
A four-part confirmation filter
Instead of reacting to the first touch beyond the level, run the breakout through four checks. If two or more are missing, treat it as a fakeout and consider fading it back into the range:
- Close beyond the level on your execution timeframe — a wick doesn't count, you need a full candle body closing outside the boundary.
- Expanding range on the breakout bar relative to the 20-period ATR — a breakout on a shrinking-range candle is low conviction.
- ADX turning up and crossing 20–25 — this confirms the market is actually shifting out of a ranging market state into directional movement, not just wobbling.
- A breakout retest that holds — see below.
The retest that holds (level flip)
The cleanest confirmation is the level flip: old resistance gets retested and holds as new support (or the mirror on the downside). Price breaks, pulls back to the former ceiling, prints a rejection wick or bullish close right at that level, and continues. That retest holding is your green light — it's the difference between a range breakout strategy that works on paper and one that survives live fills and slippage. No retest, no flip — no trade, no matter how good the breakout candle looked.
What to do when you're already trapped
If you're in a breakout that's failing, don't average down and don't move your stop "to give it room" — that's precisely how a chop day turns into a blown daily loss limit. Cut at your pre-planned invalidation, which should already be the close back inside the range, not some arbitrary distance further out. Log the trade: which of the four confirmations was missing, and what the chart looked like ten minutes later. Across enough logged fakeouts you'll start seeing your own instrument-specific tells — the same way XAUUSD tends to coil under its average daily range before a headline-driven expansion.
Spotting the Transition: Range to Trend, and Trend Back to Range
The range-to-trend transition announces itself fast and looks almost identical every time; the trend-to-range decay is slower and easier to miss until you've already given back the move. Learning to read both is what a real market regime change looks like before your P&L tells you.
Expansion signals: what changes first
Volatility contraction always comes before the break. ATR grinds down to a multi-session low, candle bodies shrink, and price starts coiling tighter against one boundary — the same pre-breakout signature you'd catch on XAUUSD before a data-driven leg. The tell that it's real: a decisive close beyond the boundary (not a wick), ADX rising through 20 and then confirming above 25, and the old boundary flipping from resistance to support (or vice versa) on the retest. Volatility expansion with all four present is your green light for a range to trend transition — one or two present without the close is usually still range noise.
The slower decay from trend into range
Trends don't die on a single candle — they fade. Watch for impulse legs getting shorter while pullbacks get deeper, often cutting 50%+ of the prior leg instead of the shallow 30-38% retracements you saw earlier in the move. ADX rolls over from above 30 back toward 20, and swing highs (in an uptrend) start clustering at nearly the same price instead of stepping higher. None of these alone confirms the shift — it's the combination, over several swings, that tells you the trend's structure has broken down into a new range.
What to redraw on the chart at each stage
- Delete the old horizontal box the moment you get a confirmed break with ADX above 25 — keeping it invites you to fade a real trend.
- Mark the new swing points as they print; don't assume the first pullback low is the new range floor until price actually reverses off it twice.
- Reset your indicator set: ADX and ATR periods that suited a quiet range may lag once the market regime change is confirmed.
- When trend decays back into range, do the same in reverse — the last two swing highs and lows become your new ceiling and floor once ADX sits back under 20.
The fractal problem: a 15-minute trend inside a daily range
Here's where most traders get whipsawed: a clean, tradeable 15-minute uptrend can be nothing more than a single leg inside a daily range that's still very much intact. Trade it as a standalone trend and you'll get stopped right at the daily ceiling. The fix is a top-down workflow and disciplined multi-timeframe analysis: set the regime — range or trend — on the Daily or 4H chart first, then drop down to your execution timeframe only to pick entries and levels. Never the other way round. The higher timeframe tells you what game you're playing; the lower timeframe just tells you when to play it.
Regime and Risk: How Chop Eats a Prop Account
A ranging market doesn't blow accounts with one bad trade — it bleeds them out through a sequence of small, correlated losses that all hit the same daily loss limit on the same afternoon. That's the mechanic every prop firm risk desk knows and most retail traders don't: chop generates more signals, smaller average moves, and lower realized R per trade, so running trend-sized risk in a range isn't one mistake, it's the same mistake five times before lunch.
Why a ranging market drains a daily loss limit fastest
In a trending market, a stopped-out trade is information — the level failed, the thesis is dead for the session. In a range, a stopped-out trade at the boundary is often just noise before price does exactly what you expected, one tick later, after your stop already got clipped. You re-enter, get clipped again. Three or four of those at full trend-size risk and you've used a meaningful slice of your daily loss limit before the actual A+ setup of the day even shows up.
Sizing down when the regime is undefined
Position sizing should be a function of regime confidence, not just stop distance. A simple framework:
| ADX reading | Regime confidence | Position size |
|---|---|---|
| Above 25, structure agrees | Confirmed trend | Full risk |
| 20–25 | Dead zone, unclear | Half risk |
| Higher timeframe vs execution timeframe disagree | Regime mismatch | No trade |
That middle band matters more than traders admit — it's where most accounts get chipped away, not blown up outright.
Two rule sets, one journal
Run trend rules and range rules as genuinely separate playbooks — different entry triggers, different stop logic, different expected R:R — and tag every journal entry with the regime you traded. Over 50 or 100 trades, this single tag usually reveals that most of your max drawdown came from regime mismatch: trend entries taken inside a range, or range fades taken into a breakout. Once you see it in the numbers, sizing down in the dead zone stops feeling like leaving money on the table and starts feeling like the only rule that kept you in the game.
Practising regime switching on simulated capital
This is a skill you want to build before it's tested with real payouts on the line, not during. A For Traders Challenge — whether Instant Funding, One-Step, or Two-Step — runs entirely on simulated capital, so you can deliberately practice cutting size in the 20–25 ADX zone and standing aside on regime mismatch without real money riding on the learning curve. Treat the evaluation's daily loss limit and max drawdown ceiling as the same guardrails a funded desk would give you, and build the regime-tagging habit now, on simulated capital, where the only cost of a mistake is a lesson.
Ready to trade funded capital?
Choose your path — Instant Accounts, One-Step or Two-Step Challenges — from just $23, with up to $300,000 in funded capital.
Choose your challengeTrading a Ranging Market: What Works For You and What Works Against You
Pros
- Boundaries are objective — you know your invalidation before you enter, which makes risk easy to define
- Higher hit rate than trend-following, because you're trading toward a known target instead of an open-ended one
- Fixed targets at the opposite boundary or midpoint remove the exit hesitation that costs traders R in trends
- Ranges are frequent — markets spend a large share of the time going nowhere, so the setup appears often
- Tight, defined structure lets you size sensibly under a max drawdown rule without guessing
Cons / risks
- Reward per trade is capped by the range width, so a single failed breakout can erase several winners
- False breakouts and stop runs cluster right where range traders place their stops
- Ranges die without warning around scheduled events like NFP and FOMC
- Oscillator signals stop working the moment the regime flips, and the flip is only obvious in hindsight
- Overtrading is the default failure mode — more signals, smaller edge, and a daily loss limit that drains one small loss at a time
Frequently Asked Questions
What is a ranging market?+
A ranging market is price bouncing between a defined support and resistance level with no sustained directional progress, typically identified by ADX below 20-25 and price respecting horizontal boundaries swing after swing. Volatility compresses relative to trending phases, and moving averages flatten out and get chopped through repeatedly instead of acting as dynamic support. Ranges form when buyers and sellers reach temporary equilibrium — often during Asian session forex hours or before major news like FOMC or NFP. The edge here is fading extremes near the boundaries, not chasing breakouts through the middle of the range.
What does ranging mean versus consolidation or a pullback?+
Ranging describes an extended sideways structure with tested, repeated support and resistance, while consolidation is a shorter pause and a pullback is a temporary retracement within an active trend. The key distinction is duration and structure — a pullback still respects the higher-timeframe trend direction and usually resolves by continuing that trend, whereas a range has no dominant directional bias at all. Consolidation often sits inside a range as a tighter sub-structure before an eventual breakout. Mixing these up leads traders to fade a pullback like it's a range top, which gets run over by trend continuation.
What is a trending market and how does it behave?+
A trending market is price making a sustained series of higher highs and higher lows (uptrend) or lower highs and lower lows (downtrend), confirmed by ADX readings above roughly 25-30 and rising. Pullbacks are shallow and get bought (or sold) quickly, moving averages slope consistently and act as dynamic support/resistance, and breakouts tend to continue rather than fail. Trending regimes reward trend-following entries on pullbacks and set-and-forget style trades with wider stops, the opposite mindset needed in a range.
Trending vs ranging market — what changes for entries and stops?+
The core shift is that trending markets reward buying pullbacks and riding momentum, while ranging markets reward fading extremes near support/resistance and taking quick profits at the opposite boundary. Stops in a trend sit below the last swing low (or above the last swing high) with room for the trend to breathe; stops in a range sit just outside the tested boundary since a break usually means the range has failed. Targets in a trend trail with structure; targets in a range are the opposite side of the box. Trading breakout strategies inside a range, or fading strength inside a trend, is where most avoidable losses come from.
What ADX reading signals trending versus ranging conditions?+
ADX below 20-25 generally signals a ranging market, while ADX above 25 and rising signals a developing trend — the absolute level matters less than the direction of the line. A rising ADX from low levels flags an emerging trend even before price makes new structure highs, giving early positioning. ADX doesn't indicate direction, only strength, so pair it with +DI/-DI or simple swing structure to know which way to lean. Treat 20-25 as a gray zone rather than a hard line — combine it with ATR and price action before committing size.
How do I identify the regime in under 30 seconds?+
Check three things fast: ADX level and slope, ATR relative to its recent average, and whether the last few swings made clean higher-highs/higher-lows or stayed boxed between two levels. Rising ADX above 25 with expanding ATR and clear swing progression says trend; flat ADX under 25 with contracting ATR and repeated tests of the same support/resistance says range. If those three disagree, default to range-based risk management since transitional periods are the most common source of fakeouts and stopped-out breakout trades.
Which indicators work in a range and which ones fail?+
Oscillators like RSI and Stochastic work best in ranges because overbought/oversold readings near boundaries are genuine reversal signals, while trend-following tools like moving average crossovers whipsaw constantly in sideways price. In a trend, the opposite is true — RSI can stay overbought for extended stretches while price keeps climbing, giving false reversal signals, whereas moving averages and ADX-based systems track the move accurately. Bollinger Bands work in both regimes differently: band-riding signals trend continuation, while band-tagging with reversal signals fits a range. Always match the tool to the regime first.
Why do pairs range so much during Asian trading hours?+
Forex pairs range heavily in the Asian session because liquidity is thin outside JPY and AUD crosses, with London and New York desks closed and no major economic catalysts typically scheduled. Lower volume means less institutional order flow to push price directionally, so it oscillates inside the prior session's range until London opens and volume returns. This is why many forex ranging market strategies specifically target Asian session box setups — trading the range low to high — then exit before the London breakout risk kicks in.
How often do markets range compared to trending?+
Markets spend the majority of time ranging — commonly cited estimates put it at roughly 70-80% of price action across most timeframes, with genuine sustained trends making up the remainder. Ranges can last anywhere from a few hours on lower timeframes to several weeks on daily charts, especially in major forex pairs during low-volatility macro periods. This is why range-based skills (fading extremes, tight risk near boundaries) matter as much as trend-following skills, even though trends generate the bigger, more memorable wins.
How should regime affect position size on a funded challenge?+
Reduce size in ranging conditions and reserve fuller size for confirmed trends, since range trades have tighter, more frequent stop-outs that erode a daily loss limit faster through repeated small losses. On a Two-Step Challenge or Instant Funding account with a hard max drawdown rule, treating a range like a trend — holding through a fakeout breakout — is the fastest way to breach the rule. Scale in only after ADX confirms trend strength, and keep range trades small and quick so a string of false breakouts doesn't compound against your daily loss limit.
Written by
Jakub Rož
Founder & CEO, For Traders
Jakub founded For Traders to build a prop trading firm with multi-asset coverage — Forex, Gold, Crypto and Futures — under a single funded-trader framework. He writes about how the prop industry actually works, what drives long-term trader performance, and where Gold and Forex strategies intersect with disciplined risk.
Follow on LinkedInReady to trade funded capital?
Choose your path — Instant Accounts, One-Step or Two-Step Challenges — from just $49, with up to $300,000 in funded capital.
Choose your challengeTrade up to $300,000
Choose challenge