Scalping Strategies: Maximizing Profits in Short-Term Trades
Scalping strategies with real numbers: five pattern breakout setups, ATR-based stops and targets, a multi-timeframe workflow and a post-fill reaction plan.

By Marcel Hambálek · Senior Trader, For Traders
Scalping strategies are short-term trading methods that target 3–15 pips (or 5–25 Nasdaq points) per trade with hold times from 30 seconds to roughly 8 minutes, using compression patterns, session levels and order flow for entries. The five working archetypes are momentum, range, breakout/pattern, news and order-flow scalping — each sized so a full stop-out costs 0.25–0.5% of equity.
Key takeaways
- A scalp is defined by hold time and structure, not screen speed: momentum scalps run 30 seconds to 3 minutes, range scalps 1–8 minutes, news scalps 5–90 seconds.
- Every setup in this guide has a numeric rule — entry at the break, stop at 1.0–1.5× ATR(14) on the trigger timeframe, first target at 1.0–1.5× the stop distance.
- The multi-timeframe triad is 15m/1h for bias, 5m for structure, 1m or 144-tick for the trigger; when the 15m and 5m disagree, you sit out rather than average the two.
- A real breakout carries expanding volume or delta through the level; a liquidity sweep pokes 0.2–0.3× ATR beyond a round number and closes back inside within two bars.
- Leverage is an output, not a setting — pick the stop first, then size so the full stop-out stays inside 0.25–0.5% of equity, and on crypto perps keep liquidation at least 5× your stop distance away.
- Prop scalpers rarely fail on strategy; they fail when a 4–5% daily loss limit turns into eight to twelve permitted stop-outs and trade number nine is revenge.
Watch: related video
What scalping strategies are — and the five archetypes
Scalping strategies target small, fast wins — 3–15 pips on FX and XAUUSD, or 5–25 points on US100 — with trades closed inside a window of 30 seconds to roughly 8 minutes. You're not holding through a pullback hoping the trend resumes. You're in, you're out, and you're doing it dozens of times a session, not two or three. The edge comes from repetition and tight risk, not from any single trade carrying your week.
Scalping vs day trading vs swing trading
The line gets blurry in casual talk, so let's make it concrete. A scalper measures targets in pips and seconds. A day trader measures in tens of pips and hours. A swing trader measures in days and full ATR ranges. None of these is "better" — they're different games with different tool sets and different nervous systems required.
| Style | Typical target | Hold time | Trades/session |
|---|---|---|---|
| Short-term scalping | 3–15 pips (FX/gold), 5–25 pts (US100) | 30s – 8min | 10–40+ |
| Day trading | 20–100 pips | 1–8 hours | 1–5 |
| Swing trading | 100+ pips / multi-day range | Days to weeks | 2–10 per week |
The five scalping archetypes at a glance
Not all scalping looks the same. A quick flip scalper strategy built for London open momentum will get chopped to pieces in a lunchtime range. Match the archetype to the regime, not the other way around.
- Momentum scalping — rides the first impulsive leg after a level breaks, usually during London/NY overlap. Needs volume confirmation and a trending tape.
- Range scalping — fades the edges of a defined box in low-volatility sessions (Asian session, pre-NFP lulls). Needs a genuinely flat market, not a fake one.
- Breakout/pattern scalping — trades compression patterns (flags, triangles) breaking on expansion, often the first move after a session open on US100.
- News scalping — captures the initial spike around FOMC or NFP prints. Needs fast execution and iron discipline on slippage tolerance.
- Order flow scalping — reads footprint/DOM imbalances for entries, common on futures and gold. Needs a liquid, two-sided tape to work at all.
How long do scalpers hold trades?
Here's the direct answer traders search for: it depends on the archetype, and the bracket is tighter than most beginners assume.
- Momentum scalping: 30 seconds – 3 minutes
- Range scalping: 1 – 8 minutes
- News scalping: 5 – 90 seconds
- Breakout/pattern scalping: 1 – 5 minutes
- Order flow scalping: 15 seconds – 2 minutes
The common thread: the trade gets closed by time and structure — a level held, a target hit, a candle failing to follow through — never by hope that "it'll come back." That distinction alone separates traders who survive a Two-Step Challenge from those who blow the daily loss limit chasing a scalp that turned into an accidental swing trade.
Scalping pattern breakout ideas: five compression setups
Compression breaks work because volatility is cyclical — price coils, then releases, and the release is where scalping breakout levels pay. Here are five named setups you can back-test on 1-minute and 5-minute charts across XAUUSD, US100 and majors, each defined by trigger, entry, stop in ATR multiples, targets, and the exact condition that invalidates it.
| Setup | Trigger | Stop (ATR 14) | Target 1 / 2 |
|---|---|---|---|
| Bull/bear flag continuation | Break of flag high/low, expanding volume | 1.2× ATR beyond flag low/high | 1.0× measured impulse leg / 1.6× |
| Wedge exhaustion break | Break of converging trendline + 1-tick buffer | 1.0× ATR beyond apex | Prior swing / measured move |
| Inside-bar squeeze | Break of inside bar + BB squeeze release, RSI >/< 50 | 1.0× ATR beyond inside bar | 1.5× ATR / 2.5× ATR |
| Opening range break | Break of first-15-min high/low + 2pt buffer (US100) | 1.0× ATR beyond OR level | OR range width / 1.5× width |
| VWAP reclaim | Close back through session VWAP after failed push | 1.0× ATR beyond wick extreme | VWAP band 1 / prior high-low |
Bull and bear flag continuation break
Bull flag scalping is the cleanest of the five: three to five corrective bars against a strong impulse leg, volume drying up on the pullback. Trigger is the break of the flag high (or low for a bear flag) with volume expanding again. Entry on that break, stop 1.2× ATR(14) below the flag low, target 1.0× the measured impulse leg for T1 and 1.6× for a trailed runner. If price breaks the flag high but immediately reverses back inside the flag body within one or two candles, that's not a failed flag — it's a liquidity sweep, and you're out at breakeven or better, not fighting it.
Ascending / descending wedge exhaustion break
Watch for converging highs and lows on the 1-minute chart with ATR contracting bar over bar — that contraction is the tell that the move is running out of room before it runs out of price. Entry triggers on the break of the wedge boundary plus a one-tick buffer to avoid a bare wick fill. Stop sits 1.0× ATR beyond the apex. Because wedges often mark exhaustion rather than continuation, treat any close back inside the wedge as invalidation — the setup has become a sweep, not a breakout.
Inside-bar squeeze and Bollinger Band compression
An inside bar squeeze paired with a Bollinger Band squeeze (bands pinching to their tightest range in 20+ bars) flags stored energy. Add an RSI momentum filter — only take the long side above RSI 50, short below — to avoid fading a squeeze into a trend. Entry on the break of the inside bar range as bands start expanding. Stop 1.0× ATR beyond the inside bar's opposite extreme. Target 1.5× ATR for T1, 2.5× ATR trailed. If price breaks and bands don't expand within two bars, the squeeze wasn't real — flatten.
Opening range break (US cash open, first 15 minutes)
On US100, opening range compression over the first 15 minutes of the cash session sets the day's first real scalping breakout level. Trigger is a break of that 15-minute high or low with a 2-point buffer to filter noise. Stop 1.0× ATR beyond the OR level, target equal to the OR range width, then 1.5× for a second leg. A break that snaps back inside the range within the first five minutes post-break is a sweep — the opening range often gets tested twice before it holds.
VWAP reclaim after a failed push
Price pushes below session VWAP, fails to attract follow-through, and reclaims VWAP on a close — that reclaim is often faster and cleaner than the original breakout. Entry on the confirmed close back through VWAP, stop 1.0× ATR beyond the failed push's wick extreme, target the first VWAP standard deviation band. Invalidation: if price closes back below VWAP within one or two bars of the reclaim, it wasn't a reclaim — it was a sweep of stops sitting just above the line.
Which scalping breakout levels are worth trading — and which are traps
The levels worth trading are the ones with the most resting liquidity and the most eyes on them — prior day high/low, Asian range edges and session opens. Everything else, including most round numbers, is bait until proven otherwise. Rank every level by who's watching it and how many stops are stacked behind it, not by how clean it looks on your chart.
The level hierarchy: session high/low, prior day high/low, Asian range edges
Not all scalping breakout levels carry equal weight. For XAUUSD, the prior day high/low and the Asian session range — the box you mark between roughly 00:00 and 07:00 GMT, before London opens — dominate. That range gets swept or respected almost every London open because it's the reference every desk marks manually. For US100, the hierarchy flips slightly: the overnight high/low and the first 15–30 minutes of the cash-open opening range matter more than the Asian box, because index liquidity concentrates around the US session.
Treat these as your A-tier levels. Intraday pivots, yesterday's mid-session swing highs, minor consolidation edges — these are C-tier at best. A break of a C-tier level with no volume behind it is noise, not a scalping breakout level.
Round numbers as magnets before they become traps
3,900 on gold, 20,000 on Nasdaq — these numbers pull price like a magnet because resting orders (limit sells, take-profits, breakout buy-stops) cluster there in disproportionate size. That's exactly why the first touch is usually a stop hunt above round numbers rather than a clean break. Price wicks through by a handful of ticks, triggers the breakout crowd's stop-entries, then reverses hard as the liquidity gets absorbed. The round number isn't support or resistance in the textbook sense — it's a liquidity pool, and pools get drained before they get broken.
The confirmation filter: volume, delta and the two-bar close rule
Here's the mechanical filter that keeps you out of most liquidity sweep traps: if price pokes less than 0.3× ATR beyond the level and closes back inside within two bars, that's a sweep — not a break. Fade it, don't chase it. A genuine break needs an expansion bar with above-average volume, or a delta confirmation in the same direction on your order-flow or footprint charts — meaningfully more aggressive buying than selling pushing through, not just price drifting past the line on thin volume.
- Sweep signature: shallow poke (<0.3× ATR), fast reclaim inside two bars, no volume expansion.
- Break signature: expansion bar, above-average volume, delta shift confirming direction, level holds as support/resistance on retest.
One more rule that saves more accounts than any indicator: never take the first touch of an untested level in the last ten minutes before a scheduled release — NFP, CPI, FOMC. Spread widens, delta gets erratic, and what looks like a clean break is often just pre-news positioning that unwinds in the first thirty seconds after the print.
Multi-timeframe scalping: the bias, structure, trigger triad
Multi-timeframe scalping works when each timeframe owns exactly one decision — never two. The 1h/15m sets direction, the 5m picks the level, and the 1m or a 144-tick chart pulls the trigger. Blend those jobs and you get a scalping setup on a clean chart that looks obvious in hindsight and impossible to execute in real time.
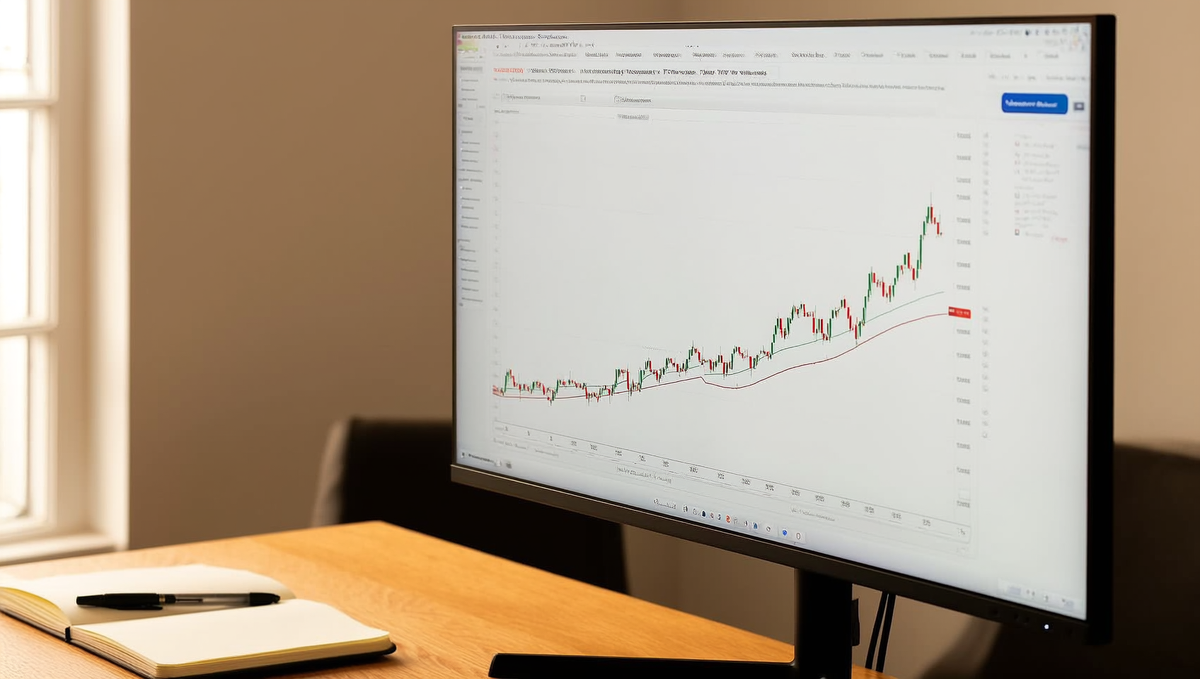
Step-by-step: building the workflow in ten minutes
- Mark bias on 1h/15m. Pull up the EMA ribbon 8/21/50. Stacked and separating = trend. Braided and flat = range. Crossing mid-move = transition — sit on your hands until it resolves.
- Drop to 5m for structure. Mark the last swing high/low and plot session VWAP. This is your only job here: pick the level you'd actually trade from, not five levels "just in case."
- Execute on 1m or a 144-tick chart. Wait for your pattern trigger — compression break, VWAP reclaim, whatever your archetype uses — to fire at the level the 5m already selected. The tick chart smooths out the dead-second noise you get on a fixed 1m during thin liquidity.
What each timeframe is allowed to decide
| Timeframe | Tool | Decision it owns |
|---|---|---|
| 1h / 15m | EMA ribbon 8/21/50 | Direction: trend, range, or transition — nothing else |
| 5m | Last swing high/low + session VWAP | Level selection — where a trade is even considered |
| 1m or 144-tick | Pattern trigger | Entry timing and stop placement only |
Notice what's missing from that table: the 1m doesn't get a vote on direction, and the 1h doesn't get to pick your stop. That separation is what keeps consistent scalping strategies consistent — you stop re-litigating the trend on every tick.
The conflict rule when timeframes disagree
Two rules, no exceptions:
- 15m bias vs. 5m structure disagree → no trade. If the 15m says trend-up but the 5m swing structure is making lower highs into VWAP, that's not a setup, it's a coin flip with extra steps.
- 5m structure vs. 1m trigger disagree → wait, don't front-run. If your level is tagged but the 1m pattern hasn't fired, that's the market telling you the level needs more work. Entering on the 5m level alone because "it's obviously going to break" is how you turn a defined-risk scalp into a guess with a stop attached.
Resist the urge to add a fourth timeframe "for confirmation." It never adds clarity — it adds permission-seeking. Every extra chart is one more excuse to skip a valid trigger because some higher timeframe you weren't even using yesterday suddenly looks "off." Three timeframes, three jobs, one trigger. That's the whole system.
The clean chart setup: what to delete before your next session
A scalper's chart needs six elements and nothing else: price, VWAP with a one-standard-deviation band, an 8/21 EMA pair, ATR(14) in a small pane, session boxes for Asia/London/New York, and — if you trade futures — a DOM or footprint pane. Everything beyond that is clutter pretending to be analysis. You've got under three seconds to decide on a scalping setup on a clean chart before the entry is gone; every extra window you have to check is time stolen from that budget.
Minimum viable layout for a scalper
Build the chart in this order and stop when you hit six:
- Price — candles or a footprint chart if your broker/platform supports order flow on futures.
- Session VWAP with 1-SD bands — your intraday fair-value anchor. Price outside the band is stretched; inside is fair game for mean-reversion scalps.
- 8/21 EMA pair — trend bias in one glance. Crossed and separating = momentum; flat and braided = range.
- ATR(14) in a small pane — sets your stop distance and tells you if the session is even worth trading.
- Session boxes — Asia, London, New York marked as shaded regions so you always know whose liquidity you're trading into.
- DOM or footprint pane — for futures scalpers, this replaces guesswork about who's actually resting size at the level.
That's the entire toolkit for live scalping with precise entries. If you can't justify a seventh element by naming the specific decision it changes, don't add it.
Indicators you can remove without losing edge
MACD on a 1-minute chart is the single most common offender — it's a lagging derivative of the same EMAs you already have on the price pane, just redrawn as a histogram with extra delay. Stochastics stacked on RSI is the same violation twice: both are momentum oscillators built off the same closes, so you're paying two decision-seconds to confirm one signal. And the multiple Fibonacci grids left over from yesterday's swing high? Delete them at the start of every session. A grid drawn on a move that's no longer live is just visual noise wearing a trader's costume.
Why stacking indicators costs you seconds you don't have
Three oscillators derived from the same price series don't triple your information — they triple your reconciliation time, because now you're resolving disagreements between tools that were never independent to begin with. Same logic applies to four moving averages of different lengths: they're correlated by construction, so conflicting signals between them are noise, not confirmation. A tick or volume chart replacing your lower timeframe is a substitution, not an addition — running both side by side just doubles your read time for the same underlying data, reformatted twice.
Your scalping market reaction plan: if-then rules for the first 30 seconds
A scalping market reaction plan is a pre-written set of if-then rules for what you do in the seconds after your fill — not what you improvise while staring at a wick. If you're deciding whether to hold or cut while the trade is open, the plan already failed; the decision needed to be made before the session started.
The four post-fill scenarios and their rules
Consistent scalping strategies aren't defined by the entry — they're defined by having an answer ready for each of these four outcomes before you click buy or sell:
| Scenario | Rule |
|---|---|
| Price stalls, no new extreme for 2 bars | Cut at market. Don't wait for the stop — a scalp that stops making progress within 2 bars on your entry timeframe has lost its reason to exist. |
| First target fills | Move stop to entry plus costs (spread + commission). Trail the runner with a 1× ATR stop, nothing tighter. |
| Spread widens beyond 1.5× normal | Do not add to the position. Do not chase an early exit — let the original stop do its job. |
| Headline lands mid-trade | Flatten immediately. The setup you entered no longer exists once new information hits. |
Partial fills, spread blowouts and news mid-trade
Partial fills and spread widening are cousins of the same problem: liquidity thinned out right when you needed it. If you get a partial fill on a scalp, treat the filled size as the full position for risk purposes — don't average in to complete the intended size at a worse price, that's chasing, not scalping. Spread widening past 1.5× its normal value is your signal that liquidity providers are pulling back, usually seconds ahead of a volatility spike; adding here just increases your slippage exposure on an already-live position.
News mid-trade is non-negotiable. Scalping around NFP, FOMC, or CPI release windows means you already know the calendar — if a headline lands while you're in a trade you opened before the release, flatten first and ask questions after. The 3-15 pip edge you're scalping for evaporates in the first repricing tick; holding through it turns a scalp into a lottery ticket.
The stop-trading trigger
Every session needs a circuit breaker written down before you take trade one, not decided in the heat of a losing streak:
- Two consecutive stop-outs: ten-minute pause, re-read your bias from scratch — don't just wait out the clock and re-enter the same idea.
- Three consecutive stop-outs: session is over. No exceptions, no "one more to get it back."
This is the line between a strategy and a system. A strategy is an idea about how price moves; a system is that idea plus the written rules for what you do when it's wrong. The rules above exist precisely because the first 30 seconds after a fill are when discipline is cheapest to keep and most expensive to lose.
Ready to trade funded capital?
Choose your path — Instant Accounts, One-Step or Two-Step Challenges — from just $23, with up to $300,000 in funded capital.
Choose your challengeLeverage, stops and the numbers for XAUUSD, US100 and crypto
Optimal leverage for scalping is an output, not a setting
The optimal leverage for a scalping stop loss strategy isn't a number you pick before the trade — it's whatever falls out once you've sized the stop from structure and capped the loss at 0.25–0.5% of equity. Set your stop first, using ATR stop sizing (typically 0.5–1.0x the 5-minute ATR) or the nearest structural swing, whichever is tighter without sitting inside noise. Then divide your risk budget by that stop distance in dollars to get position size. Leverage is the ratio that comes out the other end — sometimes 10x, sometimes 50x, depending on the instrument and how tight your stop landed. Traders who reverse this — pick max leverage, then figure out the stop — are the ones who blow a daily loss limit before lunch.
Nasdaq (US100) scalping take profit and stop loss points
US100 point value runs $1 per point per standard CFD lot (check your contract spec, it varies by broker), and in normal volatility you're working with a 12–25 point stop and a 15–35 point first target — roughly a 1:1.3 to 1:1.5 R:R baseline. Around the cash open (9:30 ET) and into the first 15 minutes, expand both numbers by about 50%: an 18–37 point stop, 22–52 point target. Trade the tight-range numbers into an expanding session and you'll get stopped on spread noise, not on being wrong. If you're scalping via CME micro futures instead of CFDs, MNQ ticks at $0.50 per 0.25-point tick — same logic, different contract multiplier.
XAUUSD tick values and realistic scalp distances
XAUUSD pip value on a standard lot is roughly $1 per 0.01 (one pip in the 4th decimal for most gold quoting conventions — confirm your broker's convention before sizing), and scalps want a $1.20–$2.50 stop with targets in the same 15–35 "point" range translated to dollars — so roughly $1.50–$3.50 targets for a comparable R:R. Gold's ATR expands hard around US CPI and FOMC, so the same stop-sizing rule applies: measure current ATR, don't reuse yesterday's distance. On the futures side, CME micro gold (MGC) trades at $1 per tick (0.10), giving you finer position sizing than the mini contract if your risk budget is small.
The spread + commission breakeven maths
This is the part most new scalpers skip, and it's why a "working" strategy still bleeds equity. Spread plus commission per round turn against a 5-pip target can eat 20–40% of your gross edge — which means your real breakeven win rate at 1:1 R:R sits well north of 50%, not at it.
| Target size | Round-turn cost (typical) | Cost as % of target | Breakeven win rate @ 1:1 |
|---|---|---|---|
| 5 pips / points | 1.5–2.0 | 30–40% | 65–68% |
| 10 pips / points | 1.5–2.0 | 15–20% | 57–59% |
| 20 pips / points | 1.5–2.0 | 7.5–10% | 53–55% |
Shrink your target, and friction doesn't shrink with it — it eats a bigger slice of a smaller pie. That's the honest math behind why the tightest scalps need either a real edge above 65% win rate or a wider R:R to survive commission per round turn.
Crypto scalping risk: position sizing so liquidation is unreachable
On BTCUSD and ETHUSD perpetuals, your stop-loss is not the worst-case outcome — your liquidation price is. Size every crypto scalp so liquidation sits at least five stop-distances from entry, and treat any trade where that math doesn't hold as unsizeable at that leverage, full stop.
This is the gap in almost every scalping guide written from an FX or index background. A wick through your stop on EURUSD or NSDQ is a losing trade — annoying, costed into your edge, done. A wick through your liquidation price on a leveraged BTCUSD perp is the end of the account, no matter how correct your read was thirty seconds later when price reversed. Crypto scalping risk management position sizing has to treat these as two separate lines, not one.
The perpetual futures position sizing framework
Keep the same discipline that works everywhere else: risk 0.25–0.5% of equity per trade, stop at 1.5× ATR(14) on your trigger timeframe. The difference with crypto perpetual futures liquidation price mechanics is what happens next — you don't stop at sizing to the stop. You then check where that position size, combined with your exchange or prop platform's margin/leverage setting, places your liquidation price. If liquidation lands inside 5× your stop distance, you reduce size or add margin. You never widen the stop to compensate — that just moves your real risk further from your intended risk, which defeats the entire framework.
Calculating distance to your liquidation price
Liquidation distance is a function of leverage and margin mode, not just your stop placement. A $50,000 BTCUSD long sized at 10x leverage on isolated margin liquidates far closer to entry than the same notional at 3x. Run the check every time size or leverage changes — don't assume yesterday's ratio still holds.
| Leverage | Approx. liquidation distance (isolated margin) | Safe if 1.5× ATR stop ≈ |
|---|---|---|
| 3x | ~30% from entry | Comfortably 5x+ clear on most scalps |
| 5x | ~18–19% from entry | Usually clear on BTCUSD scalps, check ETHUSD volatility spikes |
| 10x | ~9–10% from entry | Often fails the 5x-stop-distance test on ETHUSD scalping |
| 20x | ~4–5% from entry | Rarely safe for scalping — reduce size, not leverage alone |
Funding, weekend gaps and why crypto scalps need wider stops
Crypto ATR runs multiples of FX ATR on a like-for-like percentage basis — pip-thinking transfers badly, and traders who size BTCUSD stops the way they'd size EURUSD stops end up stopped out on noise or, worse, oversized relative to liquidation. Funding rate resets every 8 hours on most perpetual venues; a scalp that turns into an accidental hold through a funding window bleeds carry cost that was never priced into the trade's R:R. And low-liquidity hours — thin Asian session on ETHUSD, weekend gaps with no traditional close — are exactly when slippage on the exit can exceed your entire intended risk. Treat those windows as no-trade zones, not opportunities to catch a quiet breakout.
A scalping session step-by-step, from prep to journal
A repeatable scalping session runs three phases: a 20-minute prep block, a fixed execution window, and a four-line journal entry — and the metric you're tracking is rule-adherence, not P&L. Skip the structure and you're just gambling with tighter stops.
Pre-session: calendar, ATR read and level marking (20 minutes)
- Check the calendar first. NFP, FOMC and CPI windows move gold and Nasdaq 3-5x normal ATR in the first few minutes — either block that window out entirely or plan to trade the reaction, not the release itself.
- Read yesterday's ATR. If XAUUSD's daily ATR was $18, your stop and target scale come from that number, not from yesterday's stop size. A shrinking ATR means tighten size expectations; an expanding one means widen stops or sit out.
- Mark your levels. Prior day high/low, the Asian session range, and any overnight extremes go on the chart before price opens. These are your reaction zones for the session — not signals on their own, but the places where a breakout or fade actually means something.
- Write one sentence of bias. "Gold holds above 2,340 overnight range, favor longs on pullback to session VWAP." One sentence forces clarity; three paragraphs is you talking yourself into a trade you haven't taken yet.
Execution window: the London–New York overlap
Trade the London–New York overlap, 13:00–16:00 UTC — this is where gold and Nasdaq carry their deepest liquidity of the day, and it's the window built for live scalping with precise entries rather than guesswork. Outside these three hours, spreads widen and your fills get worse for the same setup.
- Cap the session at a fixed number of trades — five is a common ceiling. Once you've taken five, you're done regardless of how the sixth setup looks.
- Stop at the daily target or the circuit breaker (your max daily loss), whichever comes first. Both are exit triggers, not suggestions.
- If the first two trades violate your plan — chased entry, moved stop — end the session early. The overlap will be there tomorrow; your discipline budget for today is spent.
Post-session: the four-line journal entry
Your trading journal doesn't need paragraphs — it needs four lines, filled in within five minutes of closing the platform:
- Entry reason — the actual trigger, in one clause.
- Plan adherence — yes/no, did you follow the reaction plan you wrote pre-session.
- Cost per trade — spread plus slippage, not just the P&L line.
- One rule to test tomorrow — a single, specific adjustment, not a list of five.
Across For Traders evaluations, the traders who pass consistently are the ones whose journal shows adherence scores improving week over week — not the ones with the biggest green days. P&L is noisy on any given session; rule-following compounds.
Scalping strategies: honest pros and cons
Pros
- Fast feedback loop — you gather a statistically meaningful sample of trades in weeks, not years
- Overnight and weekend gap exposure is zero, which matters on gold and crypto
- Small stop distances mean small monetary risk per trade even on larger account sizes
- Works in both trending and ranging regimes if you switch archetype rather than force a bias
- Frequent decisions build execution discipline faster than any other style — if you journal them
Cons / risks
- Spread and commission per round turn can eat 20–40% of gross edge on a 5-pip target
- High trade frequency multiplies the cost of any single behavioural leak, especially revenge trading
- Requires uninterrupted screen time inside a narrow session window — it is not compatible with a distracted schedule
- Slippage during news and low-liquidity hours can turn a planned 1R loss into 2R
- Prop daily loss limits are hit faster by scalpers than by any other trading style
Ready to trade funded capital?
Choose your path — Instant Accounts, One-Step or Two-Step Challenges — from just $23, with up to $300,000 in funded capital.
Choose your challengeFrequently Asked Questions
What is scalping in trading?+
Scalping is a short-term trading strategy that targets small price moves — often just a few pips or points — held for seconds to a few minutes per trade. Scalpers rely on high win rates and tight risk control rather than large individual wins, executing dozens of trades a session across gold, indices, forex or crypto. The edge comes from precise entries on clean setups, not prediction, which is why execution speed and a disciplined market reaction plan matter more than complex analysis.
How does multi-timeframe scalping work?+
Multi-timeframe scalping means reading bias on a higher chart (like the 15-minute), confirming structure on a middle chart (5-minute), and pulling the trigger on a lower chart (1-minute) so all three agree before entry. This stops you from taking a long trigger inside a higher-timeframe downtrend, which is where most conflicting-signal losses happen. The rule is simple: if the higher timeframe and trigger timeframe disagree, skip the trade — there will always be another setup.
What indicators should a scalping chart use?+
A clean scalping chart needs very few tools — price action, a couple of moving averages for trend context, and volume or order flow, nothing more. Stacking RSI, MACD, Bollinger Bands and stochastic on one chart creates lag and conflicting signals at exactly the moment you need a fast decision. Most experienced scalpers strip their chart down over time, not up — the edge lives in reading candle behavior and levels, not in indicator count.
How long should you hold a scalp trade?+
Hold times vary by setup: momentum scalps typically run 30 seconds to 3 minutes, range scalps 2-5 minutes between support and resistance, breakout scalps until the impulse leg stalls, and news scalps just seconds around the spike before spreads normalize. The common thread is a predefined exit before entry — scalping without a hold-time plan turns quick trades into accidental swing trades sitting through drawdown you never intended to take.
What leverage is appropriate for scalping?+
Leverage should be sized to your stop distance and account risk limit, not maxed out just because a prop firm or broker allows high multiples. A tight stop (a few pips on forex, a handful of points on gold or US100) lets you use more leverage while still risking a fixed small percentage per trade — the leverage number itself is irrelevant without that stop-distance calculation. On funded challenges, oversized leverage relative to your stop is the fastest route to hitting a daily loss limit.
How many points should you target scalping US100 (Nasdaq)?+
Typical Nasdaq (US100) scalps target 10-30 points per trade with stops placed 8-15 points beyond the entry structure, keeping risk:reward near or above 1:1 given the index's fast tick movement. Because US100 can move 20+ points in seconds around news, stops belong just outside the recent swing point or consolidation range — not on a round number, which tends to get swept first by algorithmic liquidity hunting.
Why do prop firm traders fail scalping challenges?+
Most scalpers fail prop firm challenges by breaching the daily loss limit, not because their strategy lacks an edge. High-frequency scalping means dozens of small losses can stack quickly during a choppy session, and without a hard stop on daily trades or losses, one bad hour erases days of steady gains. Traders who pass Two-Step Challenges usually cap trades per day and walk away once a loss threshold hits, protecting the account over forcing the next setup.
Is scalping still viable against algorithmic trading in 2026?+
Scalping remains viable in 2026, but the edge has shifted away from simple indicator crossovers toward reading liquidity, order flow, and reaction speed around key levels. Algorithms dominate the millisecond arbitrage layer, but retail scalpers still profit from structural setups — breakout retests, session opens, news reaction windows — where human pattern recognition and discretion outperform mechanical execution. The traders who still scalp profitably treat it as a skill built on discipline and risk control, not a shortcut to fast rewards.
How do you size a crypto scalp trade safely?+
Size a crypto scalp so your stop loss always triggers before your liquidation price, with enough buffer to survive normal volatility spikes on the exchange or Crypto Challenge platform. A common approach caps leverage so liquidation sits at least 3-5x further from entry than your stop distance, since crypto wicks aggressively during low-liquidity hours. Skipping this math is how traders get liquidated on a move their stop should have caught first.
What breakout levels are worth trading when scalping?+
Worth-trading breakout levels are ones with clear prior rejection, session-high/low significance, or round psychological numbers backed by volume confirmation on the break. Levels that get tested repeatedly without real conviction, or sit exactly on obvious round numbers with thin volume, are frequently stop-hunt traps where price wicks through to trigger orders before reversing. Waiting for a retest and hold of the broken level, rather than chasing the initial break, filters out most of these traps.
Written by
Marcel Hambálek
Senior Trader, For Traders
Marcel trades Futures and Forex day-trading setups on funded accounts and writes about the executional details most traders skip — order types, slippage, session timing, platform quirks on MT5 and NinjaTrader. Pragmatic, mechanics-first, no fluff.
Follow on LinkedInReady to trade funded capital?
Choose your path — Instant Accounts, One-Step or Two-Step Challenges — from just $49, with up to $300,000 in funded capital.
Choose your challengeTrade up to $300,000
Choose challenge