RSI Indicator: Identifying Overbought and Oversold Conditions
RSI overbought oversold explained: Wilder's 70/30 thresholds, the 80/20 trend adjustment, divergence, and settings for XAUUSD, US100, and futures.
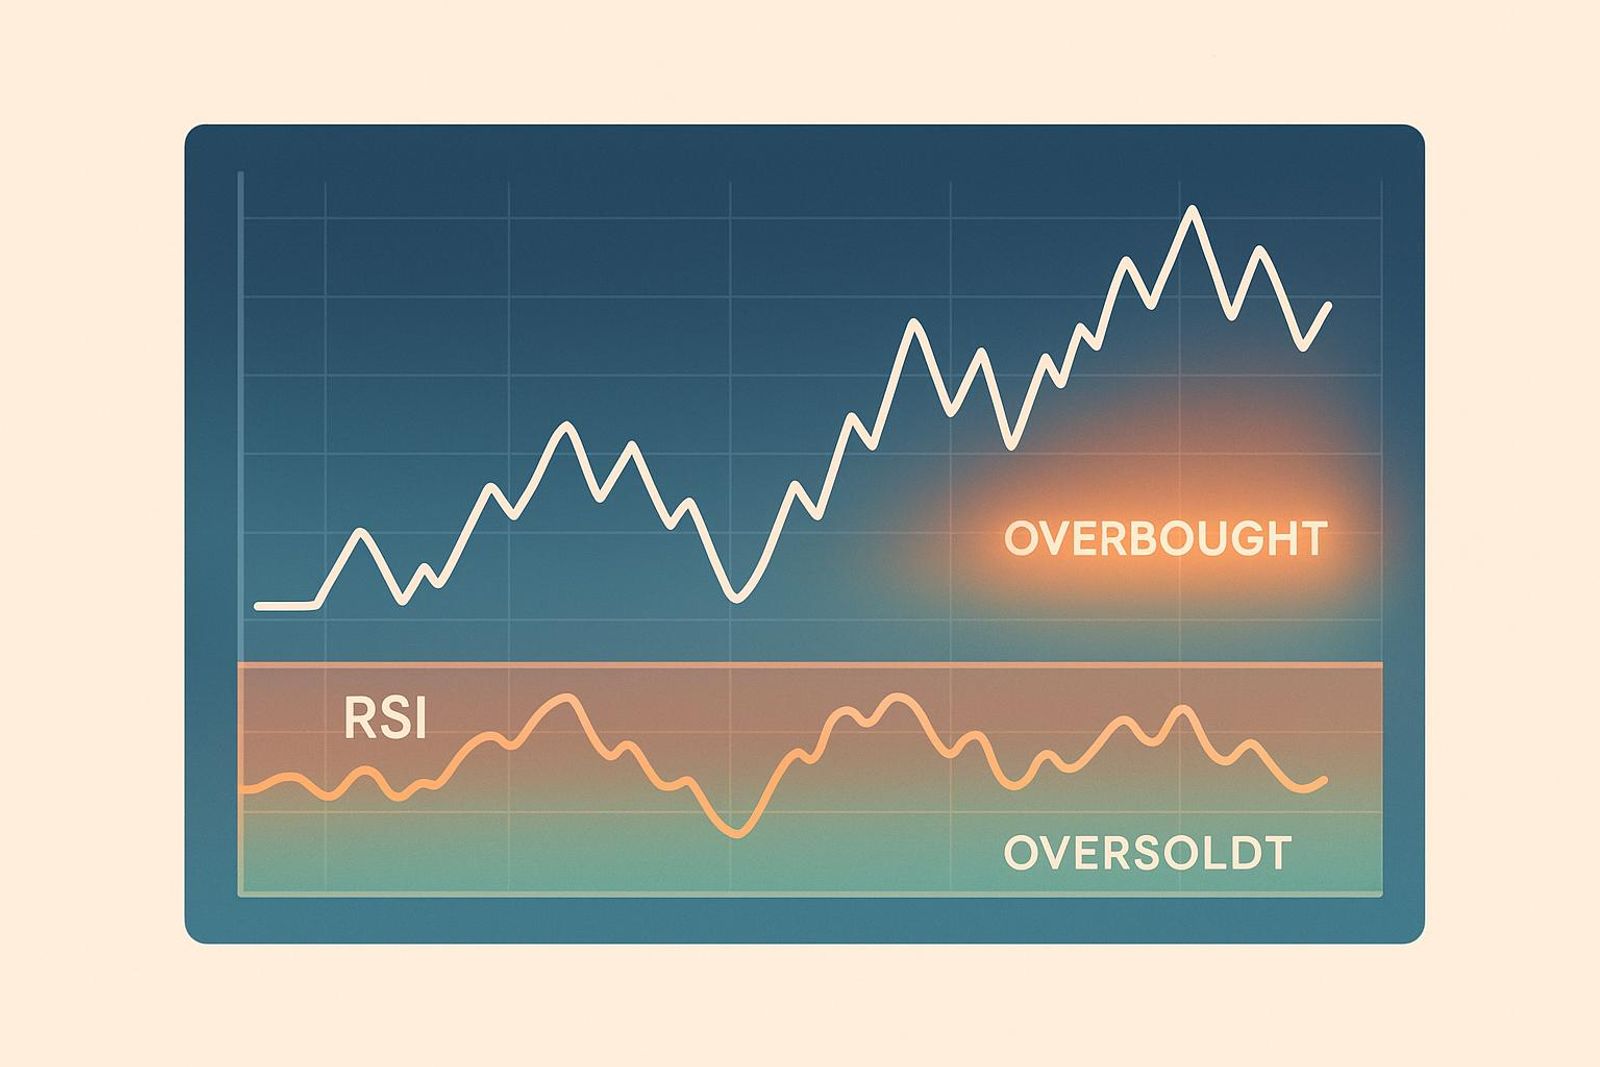
By Marcel Hambálek · Senior Trader, For Traders
In the Relative Strength Index (RSI), a reading above 70 signals overbought conditions and a reading below 30 signals oversold — thresholds defined by J. Welles Wilder Jr. in his 1978 book New Concepts in Technical Analysis Systems, and confirmed by Fidelity Learning Center, Investopedia, and the CMT Association.
Key takeaways
- RSI above 70 = overbought, RSI below 30 = oversold — the standard thresholds set by Wilder in 1978 using a 14-period default.
- In strong trends, 70/30 fires too early; disciplined traders shift to 80/20 on trending instruments like XAUUSD and US100.
- RSI divergence — where price and RSI disagree — is a stronger reversal signal than a raw threshold breach.
- The 14-period default works across timeframes, but scalpers often shorten to 7-9 and swing traders extend to 21.
- Fading RSI overbought signals in a trend is one of the fastest ways to hit a daily loss limit in a prop challenge.
- RSI is a momentum oscillator, not a timing tool — combine it with support/resistance, volume, and higher-timeframe context.
What Overbought and Oversold Mean in RSI
RSI above 70 signals overbought conditions; RSI below 30 signals oversold. Those two numbers are the foundation every RSI trader works from, and understanding where they came from — and why they're conventions rather than hard laws — separates traders who use RSI well from those who get burned by it.
The Verbatim Definition
The Relative Strength Index is a bounded momentum oscillator that moves between 0 and 100. When RSI climbs above 70, it indicates that recent gains have been disproportionately large relative to recent losses — the asset is considered overbought, meaning buying pressure may be exhausted and a pullback is possible. When RSI drops below 30, the inverse applies: recent losses dominate, the asset is considered oversold, and a bounce becomes plausible. Neither reading guarantees a reversal. They flag exhaustion, not certainty.
Where the 70/30 Numbers Came From
J. Welles Wilder Jr. introduced the RSI in his 1978 book New Concepts in Technical Trading Systems. Wilder needed a momentum measure that wouldn't run away to infinity the way raw price-change calculations do, so he engineered a ratio of average gains to average losses over a lookback period — defaulting to 14 periods — and scaled it to a 0–100 range. Once the oscillator was bounded, extreme readings became meaningful. Wilder chose 70 and 30 based on his own back-testing across commodity markets, identifying those levels as the zones where price moves historically showed signs of exhaustion.
Fidelity Learning Center, Investopedia, and the CMT Association all cite these same 70/30 defaults as the standard reference points, which is why you'll see them treated as gospel across almost every charting platform — TradingView ships RSI with 70/30 lines drawn by default, and MetaTrader does the same.
Why These Levels Have Survived 47 Years
The short answer: they work often enough to remain useful, and they're simple enough that enough traders watch them to create self-fulfilling dynamics at those levels. But the deeper reason is that Wilder's 0–100 scaling makes the thresholds universally comparable across instruments. Whether you're reading RSI on XAUUSD, the US100, or crude oil futures, a reading of 75 means the same structural thing — recent upward momentum is extreme relative to recent downward momentum.
That said, 70/30 are starting points, not laws. The table below shows how the standard thresholds hold up across different market conditions — a preview of the trending-market caveat that trips up most traders who treat RSI overbought/oversold signals as automatic entry triggers.
| Market Condition | RSI Overbought Level (Typical) | RSI Oversold Level (Typical) | Reliability of 70/30 Signal |
|---|---|---|---|
| Ranging / Sideways | 70 | 30 | High — reversals cluster near these levels |
| Strong Uptrend | 80+ (adjusted) | 40–50 (floor rises) | Low — RSI can stay above 70 for weeks |
| Strong Downtrend | 50–60 (ceiling drops) | 20 (adjusted) | Low — RSI can stay below 30 for extended legs |
| High-Volatility Event (NFP, FOMC) | 70 | 30 | Unreliable — spikes distort the average calculation |
Wilder himself acknowledged that RSI performs differently in trending versus ranging environments. The 70/30 thresholds are the right place to start — they've earned their place across 47 years of live markets — but they're the beginning of the analysis, not the end of it.
The Wilder RSI formula and how the calculation works
The RSI indicator is built on a single ratio: average gains divided by average losses over a lookback period. That ratio — called Relative Strength — gets plugged into Wilder's normalising formula to produce a value between 0 and 100. Understanding the mechanics tells you exactly why RSI behaves the way it does at extremes.
The two-step formula
Wilder's RSI formula, published in New Concepts in Technical Trading Systems (1978), has two moving parts:
- Step 1 — Calculate Relative Strength (RS): RS = Average Gain ÷ Average Loss
- Step 2 — Normalise to 0–100: RSI = 100 − (100 ÷ (1 + RS))
The normalisation step is what constrains the output. When average gains dwarf average losses, RS grows large, the denominator shrinks toward 1, and RSI approaches 100. When losses dominate, RS approaches 0 and RSI approaches 0. The 70 and 30 levels you use for RSI overbought oversold signals sit at the natural extremes of this compression.
Average gain and average loss over 14 periods
This is where most explanations get it wrong. Wilder did not use a simple moving average. He used his own smoothing method — now called Wilder Smoothing or Wilder's EMA — which carries forward the previous period's average rather than recalculating from scratch each bar.
For the first 14-period average (the seed value), it is a straight arithmetic mean:
- Initial Average Gain = Sum of all gains over periods 1–14 ÷ 14
- Initial Average Loss = Sum of all losses over periods 1–14 ÷ 14 (losses treated as positive numbers)
From period 15 onward, Wilder smoothing takes over:
- Average Gain = (Previous Average Gain × 13 + Current Gain) ÷ 14
- Average Loss = (Previous Average Loss × 13 + Current Loss) ÷ 14
This smoothing method weights recent data but never fully discards older data — which is why RSI values on a fresh chart can look slightly different from a chart with 200+ bars of history loaded. The more history your platform has processed, the more stable and accurate the RSI line becomes.
Worked example on a real price series
Below is a 15-close sequence (14 changes) showing the average gain and average loss calculation step by step. Prices are simplified for clarity.
| Period | Close | Change | Gain | Loss |
|---|---|---|---|---|
| 1 | 100.00 | — | — | — |
| 2 | 101.20 | +1.20 | 1.20 | 0.00 |
| 3 | 100.50 | −0.70 | 0.00 | 0.70 |
| 4 | 102.30 | +1.80 | 1.80 | 0.00 |
| 5 | 101.80 | −0.50 | 0.00 | 0.50 |
| 6 | 103.40 | +1.60 | 1.60 | 0.00 |
| 7 | 104.10 | +0.70 | 0.70 | 0.00 |
| 8 | 103.60 | −0.50 | 0.00 | 0.50 |
| 9 | 105.00 | +1.40 | 1.40 | 0.00 |
| 10 | 104.20 | −0.80 | 0.00 | 0.80 |
| 11 | 106.00 | +1.80 | 1.80 | 0.00 |
| 12 | 105.50 | −0.50 | 0.00 | 0.50 |
| 13 | 107.20 | +1.70 | 1.70 | 0.00 |
| 14 | 106.80 | −0.40 | 0.00 | 0.40 |
| 15 | 108.50 | +1.70 | 1.70 | 0.00 |
Seed averages (periods 2–15, 14 changes):
- Total gains: 1.20 + 1.80 + 1.60 + 0.70 + 1.40 + 1.80 + 1.70 + 1.70 = 11.90
- Total losses: 0.70 + 0.50 + 0.50 + 0.80 + 0.50 + 0.40 = 3.40
- Average Gain = 11.90 ÷ 14 = 0.850
- Average Loss = 3.40 ÷ 14 = 0.243
- RS = 0.850 ÷ 0.243 = 3.498
- RSI = 100 − (100 ÷ (1 + 3.498)) = 100 − 22.23 = 77.77
That reading of 77.77 sits above the 70 overbought threshold — which makes sense given the strong upward bias in this price series. Nine of the fourteen moves were gains, and the average gain was 3.5× the average loss.
Why 14 periods is the default
Wilder chose 14 periods because it represented roughly half a trading month — 28 calendar days compressed into approximately 14 trading sessions. That length was a deliberate compromise: long enough to smooth out single-day noise, short enough to still react to a meaningful trend shift within a few bars.
For the 14-day RSI overbought oversold framework to work as Wilder intended, the lookback needs to be long enough that a single anomalous candle doesn't distort the average calculation — but short enough that the RSI line still leads price action rather than lagging it by weeks. At 9 periods, RSI becomes hypersensitive and generates too many false signals. At 25 periods, it smooths so heavily that overbought readings only appear after a trend is already exhausted. The 14-period default sits in the pragmatic middle, which is why it has survived unchanged across nearly five decades of live markets.
How to identify overbought and oversold zones on the chart
Spotting overbought and oversold conditions in practice comes down to two things working together: what the RSI panel is telling you numerically, and what price itself is doing at that exact moment. Neither alone is enough.
Reading the RSI panel below price
On virtually every charting platform — TradingView, MT4, MT5 — the RSI plots as a separate oscillator panel beneath the price chart, bounded between 0 and 100. Two horizontal reference lines matter most: 70 (overbought) and 30 (oversold). These are the RSI 70/30 levels Wilder defined in 1978, and they remain the default on every platform because they work across enough market conditions to be the universal starting point.
The visual read is straightforward: when the RSI line rises into the zone above 70, the instrument is considered overbought. When it drops below 30, oversold. Watch the line's momentum as it enters those zones — a steep, fast push into overbought territory carries different weight than a slow drift that barely crosses 70 before turning flat.
The difference between touching 70 and closing above 70
This distinction separates disciplined traders from impulsive ones. A single RSI bar that wicks above 70 on a 4-hour chart and immediately retreats is a weak signal — the oscillator touched the threshold but the move lacked conviction. What you want to see is multiple consecutive closes above 70, ideally with the RSI line holding elevated rather than rolling over at the first touch. In trending markets, especially on XAUUSD during a momentum leg, RSI can stay above 70 for ten or more candles without a meaningful reversal. Treating the first touch as a sell trigger in that environment gets you chopped out repeatedly.
The same logic applies below 30. One candle dipping under the line during a sharp sell-off is not the same as RSI grinding along the 25–28 range across multiple sessions — the latter suggests genuine selling exhaustion, not just a brief spike in bearish momentum.
Identifying overbought price action beyond the reading
Learning how to identify overbought price action means looking at the candles themselves, not just the oscillator. An RSI above 70 is more credible as a reversal warning when price is simultaneously showing:
- Parabolic candles — a sequence of wide-range bullish bars where each close is near the high, often accelerating in size. This is late-trend behaviour.
- Exhaustion gaps — price opens significantly above the prior close after an extended run. These gaps frequently fill when the move reverses.
- Wide-range bars into resistance — a single large candle pushing into a known supply zone, prior swing high, or round number. The bigger the candle, the more likely it represents the last buyers capitulating into the move.
When you see RSI above 70 and one or more of these price characteristics at a structural level, the probability of at least a short-term pullback rises meaningfully. One signal without the other is noise. Both together is a setup worth watching.
Failure swings — Wilder's original confirmation signal
Wilder himself was skeptical of raw threshold crossings as standalone triggers, which is why he introduced the failure swing as a cleaner reversal signal. Here is how it works on the overbought side:
- RSI pushes above 70 — the first peak.
- RSI pulls back below 70 — a minor retreat, not necessarily back to 50.
- RSI rallies again but fails to exceed the first peak — this is the critical moment.
- RSI then breaks below the pullback low — the failure swing confirmation.
That final break below the prior pullback low is the trigger, not the initial overbought reading. The logic is sound: if price is genuinely strong, RSI should make a higher high on the second push. When it can't, internal momentum has already shifted even if price is still climbing. On XAUUSD daily charts, failure swings at overbought have historically preceded some of the sharpest corrective legs in gold — the divergence between RSI structure and price structure is the tell. It is a more demanding setup to identify than simply watching the 70 line, but it produces far fewer false entries.
Why 70/30 lies to you in a strong trend (the 80/20 adjustment)
In a genuine trending market, the standard 70/30 thresholds don't signal reversal — they signal that momentum is working exactly as intended. Fading a reading above 70 in a strong uptrend isn't contrarian trading; it's fighting the tape with a broken weapon.
The trending-market problem
Here's the mechanics: momentum feeds on momentum. When institutional order flow is consistently directional — large funds rotating into gold, or systematic buyers piling into US100 futures — each price leg brings in more buyers, which pushes RSI higher, which keeps it there. The oscillator saturates. It isn't broken; it's accurately reflecting the relentless buying pressure. But if you've been trained to short every RSI 70 touch, you get buried on the next leg up, and the one after that.
This is the most common way retail traders lose money using RSI. They treat an overbought reading as a sell signal in a market that has no intention of turning. On XAUUSD, which is the most actively traded instrument on the For Traders platform, this pattern plays out repeatedly — gold enters a momentum phase, RSI pins above 70, and every early short gets squeezed out before the actual exhaustion arrives.
When to shift to 80/20 thresholds
The practical rule is straightforward: when price is making a sustained series of higher highs and higher lows on your trading timeframe, shift your overbought threshold to 80 and your oversold threshold to 20. The 80/20 adjustment filters out the noise of a trending market and forces you to wait for genuine exhaustion rather than routine pullback territory. The same logic applies in reverse for downtrends — RSI can sit below 30 for extended periods, and only a drop toward 20 marks the real capitulation.
Instruments where this adjustment matters most include XAUUSD, US100, and NQ futures — all high-momentum assets with strong institutional participation that can sustain directional pressure far longer than mean-reversion models expect.
Constance Brown's bull/bear range refinement
Technical analyst Constance Brown formalised this thinking in her book Technical Analysis for the Trading Professional. Her core insight: RSI doesn't oscillate symmetrically around 50 in all market conditions. In a bull market, RSI tends to range between roughly 40 and 80 rather than the textbook 30 to 70. The 40 level acts as support during pullbacks; readings above 80 mark genuine overbought exhaustion. In a bear market, the range inverts — RSI oscillates between approximately 20 and 60, with 60 acting as resistance and readings below 20 flagging real capitulation.
This reframing is useful because it explains why RSI regularly "fails" at 30 in a downtrend without reversing, and why 70 gets touched repeatedly in an uptrend without producing a sell signal. The oscillator is behaving correctly — your reference frame is the problem.
| Market Condition | Overbought Threshold | Oversold Threshold | RSI Operating Range |
|---|---|---|---|
| Ranging / No Trend | 70 | 30 | 30–70 |
| Strong Uptrend (Bull) | 80 | 40 | 40–80 (Brown's bull range) |
| Strong Downtrend (Bear) | 60 | 20 | 20–60 (Brown's bear range) |
Live example: fading gold at RSI 70 vs waiting for 80
During the XAUUSD rally from February through May 2024 — when gold broke through $2,100 and pushed toward $2,400 — RSI on the daily chart held above 70 for the better part of eight consecutive weeks. Traders who shorted the first RSI 70 touch in late February were staring at 200+ points of open loss within three weeks. Those who applied the 80/20 adjustment waited. RSI eventually pushed into the 82–85 zone in mid-May, price action showed a clear bearish engulfing on the daily with volume contraction, and the subsequent corrective leg gave back nearly $180 in a matter of days — a clean, high-probability short rather than a series of painful early fades.
The adjustment doesn't guarantee the entry. It does mean you stop fighting the trend and start waiting for the market to show you that momentum has genuinely stalled. On trending instruments like XAUUSD and US100, that patience is the difference between consistent RSI overbought oversold signals and getting run over by the very momentum the indicator is measuring.
RSI divergence: the signal that beats raw thresholds
When price and RSI stop agreeing with each other, that disagreement is often more informative than any overbought or oversold reading on its own. RSI divergence — the gap between what price is doing and what momentum is doing — is where the indicator earns its real keep, and it works across every asset class from XAUUSD to the US100 to individual futures contracts.
There are four distinct types. Two signal potential reversals. Two confirm trend continuation. Most traders only learn the first two, which is why the other two keep catching them off guard.
Regular bullish divergence
Price prints a lower low; RSI prints a higher low. That mismatch tells you selling pressure is losing force even as price makes a new trough. The bears are still pushing, but they're pushing with less momentum than the previous swing. On a 4H XAUUSD chart, you'll often see this form at the end of a multi-day pullback — price undercuts the previous swing low by a few dollars, RSI stays well above its prior trough, and the next candle closes back inside the range. That's your reversal signal, long bias, stop below the new price low.
Regular bearish divergence
Price prints a higher high; RSI prints a lower high. Bulls are still making new highs, but they're doing it on weakening momentum. This is the classic exhaustion signal in extended uptrends. On US100 during a late-session grind higher, you'll frequently see RSI peak around 65–68 on the second high while price is 0.5–1% above the prior high. That failure to reclaim overbought territory on a new price high is the tell. Bearish divergence confirmed, short bias, stop above the new price high.
Hidden bullish divergence (trend continuation)
Price prints a higher low; RSI prints a lower low. This is the under-taught one. Price is respecting the uptrend — it's pulling back but staying above the prior swing low. RSI, however, dips deeper than it did on the previous pullback. That sounds alarming until you understand what it means: the pullback is shallow in price terms but looks deep on the oscillator. Momentum is resetting without price breaking structure. In a trending market, this is a gift. It's the pullback-to-trend entry you've been waiting for, and it's more reliable than a regular reversal signal precisely because the trend is already doing the work for you.
Hidden bearish divergence (trend continuation)
Price prints a lower high; RSI prints a higher high. Mirror image of hidden bullish. Price is already making lower highs — the downtrend structure is intact — but RSI is tagging higher readings on the bounce. The bounce looks strong on the oscillator, but price can't recover prior structure. Sellers are in control. This is your continuation short in a downtrend, not a reversal long. Traders who misread the elevated RSI as oversold recovery get caught on the wrong side of this one repeatedly.
How to filter out fake divergences
RSI divergence signals fail most often when traders draw them carelessly in the middle of the RSI range. The rule is simple: the second RSI peak or trough must occur outside the 30–70 zone. A regular bullish divergence where the second RSI low is at 45 isn't a divergence — it's noise. You need that second low below 30, or at minimum approaching it. For regular bearish, the second RSI high should be above 70 or clearly failing to reach it from a prior overbought reading.
The second filter is structural confirmation. Don't act on the divergence until price breaks the swing point that defines the pattern. For regular bullish, wait for price to close above the most recent swing high between the two lows. For hidden bullish in an uptrend, wait for price to break above the lower high that formed during the pullback. A divergence without structural confirmation is a hypothesis. A divergence with a structure break is a trade.
These two filters — RSI zone requirement and swing-point break — will cut your divergence signals by roughly half. The half that remains will be substantially cleaner. That's the trade-off worth making.
Best RSI Settings by Instrument and Timeframe
The default RSI(14) with 70/30 thresholds is a starting point, not a universal law. Different instruments trend at different velocities, mean-revert at different rates, and carry different volatility profiles — and your settings need to reflect that reality.
XAUUSD (Gold): The Trending-Metal Adjustment
Gold is the single most-traded instrument in prop trading challenges for a reason: it moves with conviction. When XAUUSD trends, it trends hard — and the standard 70/30 thresholds fire early, leaving you short on a setup that runs another 200 pips against you.
On the H4 and Daily charts, shift your overbought and oversold thresholds to 80/20 while keeping the period at 14. This keeps you out of premature counter-trend fades during sustained gold runs. In ranging conditions — identifiable by ATR compression and price oscillating inside a defined structure — you can revert to 70/30. The regime determines the threshold, not the instrument alone.
US100 / NSDQ and NQ Futures: Growth-Index Momentum
US tech indices share gold's trending bias during risk-on phases. RSI(14) with 80/20 thresholds is the right configuration when US100 or NQ futures are in a clear directional leg — particularly during FOMC-driven momentum or post-NFP trend days. In consolidation, where price chops between support and resistance, drop back to 70/30 so the indicator generates actionable signals instead of staying pinned near the midline. The switch between these two modes is a judgment call, but a 20-day ATR reading and a quick look at the structure of the last 10 candles will tell you which regime you're in.
EURUSD and Major Forex: Classic 14-Period Behaviour
Forex major pairs — EURUSD especially — mean-revert more reliably than gold or growth indices. Liquidity is deep, institutional participation is constant, and extended one-directional RSI readings are less common outside of macro event days. RSI(14) with the standard 70/30 thresholds still earns its keep here. This is the environment Wilder's original settings were designed for: a liquid, two-sided market that respects extremes.
Bitcoin and Crypto: Shorter Periods for Faster Cycles
Crypto moves in compressed cycles. A momentum swing that takes two weeks to develop on EURUSD can complete in 48 hours on Bitcoin. RSI periods of 9 to 11 capture this velocity without lagging so far behind that the signal arrives after the move. Thresholds of 70/30 remain reasonable on higher timeframes; on lower timeframes during volatile sessions, some traders widen to 75/25 to filter noise.
Timeframe Overlay: Scalping, Day Trading, Swing Trading
Period length should scale with your holding time. Shorter timeframes need faster RSI reactions; longer timeframes benefit from smoother readings that don't whipsaw on every candle.
| Trading Style | Typical Timeframe | RSI Period | Threshold Suggestion |
|---|---|---|---|
| Scalping | 1-min / 5-min | 7–9 | 70/30 (tighten to 75/25 in trend) |
| Day Trading | 15-min / 1H | 10–14 | 70/30 standard; 80/20 in strong trend |
| Swing Trading | 4H / Daily | 14–21 | 70/30 or 80/20 depending on instrument |
| Position Trading | Weekly | 21 | 70/30; treat extremes as macro signals |
RSI settings for day trading sit in a practical middle ground: period 10–14 gives you enough sensitivity to catch intraday momentum shifts without the noise that makes a 7-period RSI on a 15-minute chart nearly unreadable. Swing traders who push to RSI(21) on the 4H or Daily will see fewer signals — but the signals they do see tend to align with meaningful structural levels, which is exactly the filter that keeps you out of low-quality setups.
Ready to trade funded capital?
Choose your path — Instant Accounts, One-Step or Two-Step Challenges — from just $23, with up to $300,000 in funded capital.
Choose your challengeCombining RSI with Price Action, S/R, and Volume
RSI alone is essentially a coin flip in a trending market — but stack it with structural confluence and you shift the odds meaningfully in your favour. An oversold reading sitting on top of a well-tested horizontal support level is a fundamentally different signal from the same reading in open air, and treating them identically is one of the most common mistakes in any RSI trading strategy.
RSI at Horizontal Support and Resistance
The principle here is simple: RSI with support resistance confluence filters out the noise that kills standalone oscillator signals. When price drops into a zone that has held at least twice before — a level the market has explicitly voted on — and RSI simultaneously prints below 30, you have two independent data streams agreeing. Neither one is enough on its own, but together they narrow the probability space considerably.
On the US100 4H chart, for example, a horizontal support level that has rejected price three times carries real weight. If RSI(14) dips to 28 as price touches that zone, you're not chasing an oversold bounce into nothing — you're watching RSI confirm what structure already told you. The same logic applies in reverse at resistance: RSI pushing above 70 at a level that has capped price repeatedly is a far stronger case for mean reversion than an overbought reading at an all-time high with no overhead structure to reference.
One practical rule: require the support or resistance level to have been tested at least twice on the same timeframe you're trading. A single touch is a data point; a double or triple test is a level the market respects.
RSI with Volume Confirmation
Volume is the lie detector of price action, and RSI confluence improves dramatically when you read it alongside the volume bars. Two distinct volume signatures matter here, and they tell opposite stories.
Climactic volume into overbought: A sharp volume spike as RSI crosses above 70 often signals exhaustion — buyers rushing in at the top, creating the fuel for a reversal. This is the classic blow-off pattern. When you see RSI push into overbought territory on a candle whose volume is two or three times the 20-bar average, the move is more likely ending than continuing.
Dwindling volume into overbought: A slow, low-volume grind above 70 reads differently. The trend isn't exhausted — it's just resting. Fading that signal prematurely has cost traders more money than almost any other misread. Wait for volume to confirm participation before assuming the move is done.
RSI with volume working together gives you context that the oscillator alone can never provide. Same RSI reading, completely different trade.
RSI Plus Candlestick Reversal Patterns
Candlestick signals are your entry timing mechanism within the RSI confluence framework — they don't generate the trade idea, they confirm it's time to act. A pin bar rejecting off support while RSI sits at 28 is a far cleaner entry trigger than a market order the moment RSI crosses the 30 line. A bullish engulfing candle forming at that same support zone tells you buyers showed up with enough conviction to swallow the prior candle entirely.
The patterns worth prioritising in this context: pin bars (long lower wick, small body — rejection of lower prices), bullish and bearish engulfing candles, and inside bars breaking in the direction of the expected reversal. Each one represents a shift in order flow that aligns with what RSI and structure are already suggesting. Three independent signals — level, oscillator, candlestick — is the minimum threshold for a high-quality RSI confluence setup.
The Higher-Timeframe Filter
Even a three-factor confluence setup on the 1H can be a losing trade if it runs against the 4H or Daily trend. The higher-timeframe filter is straightforward: only take RSI reversal signals in the direction of the prevailing higher-timeframe trend, or against clear exhaustion at a major higher-timeframe level.
If the Daily chart is in a clean uptrend and your 4H RSI dips to oversold, that's a pullback entry — you're buying into temporary weakness within a larger bullish structure. That's a very different risk profile from fading a 4H overbought reading when the Daily trend is also pointing up. In the latter case, you're fighting momentum on two timeframes simultaneously.
Reserve counter-trend RSI signals for situations where the higher timeframe itself shows exhaustion: a major weekly resistance level, a multi-month supply zone, or an RSI divergence visible on the Daily. Anything less and you're not trading confluence — you're trading hope.
RSI vs MACD vs Stochastic for Spotting Exhaustion
RSI sits between two extremes: MACD is slower and trend-focused, stochastic is faster and noise-prone. For identifying exhaustion at price extremes, RSI is the most reliable of the three — but knowing when to hand off to the others is what separates competent chart readers from mechanical ones.
What Each Indicator Actually Measures
These three are often grouped together as momentum oscillators, but they measure fundamentally different things:
- RSI compares the average gain to the average loss over a lookback period (default 14). It tells you how strongly price has moved in one direction relative to the other — a bounded reading between 0 and 100.
- MACD (moving average convergence divergence) tracks the relationship between two exponential moving averages — typically the 12 and 26 EMA — and plots their difference as a histogram. It is not bounded. It tells you whether momentum is accelerating or decelerating in a trend, not whether price is stretched.
- Stochastic compares the current closing price to the high-low range over a recent period (default 14). It answers: where in the recent range did price close? It oscillates between 0 and 100 like RSI but reacts faster and reverts more aggressively.
Signal Speed vs Signal Reliability
Speed and reliability pull in opposite directions. Stochastic generates overbought/oversold signals earliest — often too early in a trending market, where it can pin at 80+ for extended periods before price reverses. MACD generates signals latest, but those signals carry more weight in trending conditions because the indicator needs sustained momentum to cross. RSI sits in the middle: smoother than stochastic, more reactive than MACD, and bounded in a way that makes the 70/30 thresholds meaningful across timeframes.
When RSI Wins and When It Loses
The scenario matrix below is the practical way to think about this. No single indicator dominates every context.
| Trading Scenario | Best Fit | Why |
|---|---|---|
| Exhaustion at range extremes | RSI | Bounded readings give clear overbought/oversold reference; divergence is readable |
| Trend continuation / pullback entries | MACD | Histogram crossovers confirm momentum resumes without false exhaustion signals |
| Scalp entries on sub-15m timeframes | Stochastic | Faster signal generation suits rapid mean-reversion setups in tight ranges |
| High-conviction reversal at key level | RSI + MACD divergence | Layering both filters out noise; agreement between the two raises conviction |
| Strong trending market (e.g. NFP breakout) | Avoid RSI overbought/oversold | RSI stays pinned; signals are premature and costly |
RSI loses badly in strong directional moves — think XAUUSD ripping 40 dollars on a geopolitical headline. The indicator can sit above 75 for the entire move while price adds another 60 points. Fading that because RSI looks "overbought" is one of the most common ways traders blow a daily loss limit on a single position.
Can You Run Them Together?
Yes — selectively. The combination that adds genuine value is RSI divergence confirmed by MACD histogram divergence. If RSI is printing a lower high while price prints a higher high, and the MACD histogram is simultaneously showing shrinking bullish bars, you have two independent momentum measures agreeing that buying pressure is fading. That's a high-conviction reversal setup worth sizing into, not just a marginal RSI reading you're hoping holds.
Adding stochastic on top of RSI rarely improves signal quality — they're measuring similar things at similar speeds and tend to confirm each other trivially. Where stochastic earns its place is on a separate, lower timeframe chart for entry timing once RSI on the higher timeframe has already flagged the exhaustion zone. Use RSI to identify the area, stochastic to time the candle.
Common RSI mistakes that bust prop challenges
Most evaluation accounts don't fail because the trader couldn't read RSI — they fail because the trader trusted RSI too literally at exactly the wrong moment. Here are the five mistakes that show up repeatedly in blown prop challenge accounts, and what to do instead.
Fading a strong trend at 70
XAUUSD can print RSI readings above 70 for days during a genuine macro rally. If you short every touch of 70 because "it's overbought," one sustained trend day can eat your entire daily loss limit before London close. RSI at 70 in a trending market is not a reversal signal — it's confirmation that momentum is real. The fix is simple but requires discipline: don't fade RSI extremes until price action gives you a structural reason to. A lower high, a failed breakout attempt, a bearish engulfing on elevated volume — those are your triggers. RSI at 70 alone is not.
Ignoring higher-timeframe RSI context
A 5-minute RSI reading of 28 looks like a textbook oversold bounce setup. But if the 4-hour RSI is sitting at 45 and trending down, you're not buying a dip — you're buying into ongoing selling pressure. The lower timeframe is showing a momentary pause, not exhaustion. Always anchor your RSI read to at least one higher timeframe before committing size. If the daily RSI is still falling, your "oversold" entry on the 15-minute chart is just noise with a bid attached to it.
Sizing up on 'obvious' oversold bounces
The most dangerous RSI mistake in prop challenge risk management is averaging into a position because RSI keeps printing lower lows and "it has to bounce eventually." It doesn't have to do anything. A stock or futures contract breaking down structurally can stay oversold on RSI(14) for weeks. Every add-on increases your exposure to a gap or a continuation candle that takes you straight to max DD in a single session. The alternative: treat your first entry as your full entry when RSI context is unclear. If you need to add, wait for RSI to reclaim a threshold — not just stop falling.
Trading RSI signals into news events
Scalping an RSI(14) oversold signal on a 1-minute chart during an FOMC release is not a trade — it's a coin flip with slippage attached. High-impact news events collapse the normal relationship between price action and momentum indicators. RSI can spike from 25 to 75 in two candles, or the spread widens and your fill comes in 15 pips off your intended entry. The discipline here costs nothing: check the economic calendar before the session, mark the high-impact windows, and either stay flat or wait for the initial volatility to resolve before re-engaging RSI signals.
Not adapting thresholds to the instrument
Wilder's 70/30 defaults were calibrated for a different era of commodity markets. XAUUSD in a trending regime regularly oscillates between 50 and 80 without touching 30. Crypto instruments can pin RSI above 70 during parabolic moves for sessions at a time. Using rigid 70/30 thresholds across every instrument and timeframe is one of the quieter RSI mistakes — it looks reasonable on the surface but systematically puts you on the wrong side of strong-trending assets. Adjust your overbought threshold to 80 on volatile trending instruments, and consider 40 as the oversold anchor in a confirmed downtrend. Let the instrument's historical RSI behaviour set the goalposts, not a default from 1978.
Building a full RSI rules system for a Two-Step Challenge
A rules system isn't a collection of ideas — it's a set of conditions that all have to be true before you touch the simulated capital on your For Traders Two-Step Challenge account. Here's one that holds together under pressure.
Entry rules with confluence
RSI alone is not an entry signal. It's a filter. Your actual entry requires four conditions to stack simultaneously:
- RSI(14) beyond the adjusted threshold. On XAUUSD and US indices (US100, US30), that means 80 for overbought and 20 for oversold. On forex pairs and lower-volatility instruments, use the classic 70/30. A reading that barely grazes the threshold and reverses immediately is noise — wait for a clear excursion and a close back inside the band.
- Divergence confirmed. Price makes a new extreme; RSI does not. Regular bearish divergence at overbought, regular bullish at oversold. No divergence, no trade — this single filter cuts a large portion of false signals in trending markets.
- S/R confluence. The RSI extreme should coincide with a meaningful structure level: a prior swing high or low, a daily or weekly VWAP, a round number with historical reaction, or a Fibonacci retracement that the market has respected before. If RSI hits 80 in open air with no structure nearby, you're guessing.
- Higher timeframe alignment. Before you execute on the 15-minute or 1-hour chart, check the 4-hour or daily. If the HTF trend is still clearly pointing in the same direction as your counter-trend RSI trade, reduce size or skip entirely. You want HTF momentum either neutral or showing its own exhaustion.
Position sizing against daily loss limit
Risk 0.5% of the challenge account per trade. On a $100,000 Two-Step Challenge account that's $500 per trade. A ten-trade losing streak — brutal, but survivable — costs you 5% of account value. Most For Traders Two-Step Challenge structures carry a daily loss limit in the region of 4–5% and a max drawdown of 8–10%. Sizing at 0.5% per trade means you need an extraordinary run of consecutive losses before you're anywhere near those rails. That's the point: protect your ability to keep trading, not your ego about position size.
Stop placement using ATR, not RSI
RSI doesn't tell you where price is structurally invalidated — ATR does. Place your stop 1.5× the 14-period ATR beyond the candle extreme that formed your signal. If gold's ATR is 12 points and the signal candle high is 2,385, your stop goes at 2,385 + 18 = 2,403. Not at 2,400 — that round number gets hunted first. The ATR multiple gives your stop room to breathe through normal volatility without sitting at the exact level every algorithm in the room is targeting.
Exit rules: mean reversion vs trailing
Split your position into two halves. Take the first half off when RSI crosses back through the midline at 50 — that's the mean reversion completing its primary move. Move your stop to breakeven on the remainder. Then trail the second half using a 1× ATR trailing stop, updated on each closed candle. This structure lets you bank a clean partial reward on the high-probability leg while keeping exposure to the occasional trade that turns into a full trend reversal. Most RSI mean-reversion setups won't give you a full trend — but the ones that do cover a lot of scratch trades.
Journaling and iterating the system
Every RSI signal your instruments generate gets logged, whether you traded it or not. Record the threshold level, whether divergence was present, the S/R context, HTF alignment, the outcome, and — critically — why you skipped it if you did. After 30 logged signals you'll start to see patterns the rules don't yet capture: maybe divergence without S/R confluence fails 80% of the time on your instrument, or maybe gold signals above 82 perform better than those between 80 and 82. That's the data that makes a generic RSI trading strategy into your RSI trading strategy. The prop trading rules system you start with is a hypothesis. The journal is how you test it against reality — even when that reality is simulated capital on a challenge account.
RSI glossary: entities and terms in one line each
Every term below is defined in a single sentence — precise enough to use as a reference mid-session, clear enough for any context to extract and apply directly.
Ready to trade funded capital?
Choose your path — Instant Accounts, One-Step or Two-Step Challenges — from just $23, with up to $300,000 in funded capital.
Choose your challengeRSI: strengths and weaknesses at a glance
Pros
- Bounded 0-100 scale makes extremes visually obvious
- Works across every asset class and timeframe
- Wilder's original formula and 70/30 thresholds are universally supported by charting platforms
- Divergence signals catch reversals the raw price chart misses
- Simple enough to backtest and code into a rules system
Cons / risks
- 70/30 fires too early in strong trends — traders get run over on XAUUSD and US100
- Prone to false signals during low-volume, choppy conditions
- Lagging by design — the smoothing means it confirms after price has already moved
- Requires confluence (S/R, HTF, volume) to be genuinely tradable
- Every retail platform ships it — no informational edge in the indicator itself
Frequently Asked Questions
What does overbought and oversold mean in RSI?+
RSI overbought means the indicator has risen above 70, signalling that recent gains may be excessive relative to the lookback period — oversold means it has fallen below 30, signalling the opposite. J. Welles Wilder introduced these thresholds in his 1978 book 'New Concepts in Technical Trading Systems', and they remain the standard reference cited by the CMT Association, Investopedia, and Fidelity Learning Center. Neither reading is a trade signal on its own — they mark zones where exhaustion becomes probable, not guaranteed.
Where do the RSI 70 and 30 thresholds come from?+
Wilder set 70 and 30 as his original overbought and oversold boundaries when he published RSI in 1978, derived from empirical observation across commodity markets. The CMT Association's curriculum, Fidelity Learning Center, and Investopedia all cite these same levels as the canonical defaults. Wilder himself noted they were starting points, not rules — he acknowledged that in strong trending markets, RSI can stay above 70 or below 30 for extended periods without reversing.
How do you correctly identify overbought zones on a 14-period RSI?+
A 14-period RSI reading above 70 places price in the overbought zone, but correct identification requires more than a single candle breach. Look for RSI to enter the zone, peak, and then roll back below 70 — that rollover is the signal, not the initial cross. Combine it with price context: is RSI hitting 70+ near a known resistance level, a prior swing high, or a round number? Confluence between the RSI zone and price structure is what separates a tradeable setup from noise.
How do RSI thresholds shift in strong trending markets?+
In strong uptrends, RSI routinely holds above 50 and can stay in the 70–80 range for weeks — fading every overbought reading gets expensive fast. Many experienced traders shift to an 80/20 filter in trending conditions: only treat RSI above 80 as meaningful overbought, and below 20 as meaningful oversold. This adjustment reduces false counter-trend signals and keeps you aligned with momentum. On instruments like XAUUSD during a sustained bull run, the 80/20 filter has historically produced cleaner mean-reversion entries.
What is RSI divergence and why is it stronger than the threshold alone?+
RSI divergence occurs when price makes a new high (or low) but RSI fails to confirm it — a sign that momentum is fading even as price extends. Bearish divergence at overbought levels (price higher, RSI lower) is a significantly stronger exhaustion signal than RSI simply touching 70. It shows the buying pressure required to push price up is shrinking. Divergence combined with a resistance level or a supply zone is one of the highest-probability RSI setups available across forex, gold, and index futures.
What RSI settings work best for XAUUSD and US100?+
The default 14-period RSI is the most widely watched setting on both XAUUSD and US100, which matters because levels that many traders watch tend to act as self-fulfilling reference points. For shorter-term intraday setups on gold, some traders tighten to a 9-period RSI to capture faster momentum shifts. On US100, the 14-period on the 1H or 4H chart aligns well with institutional session rhythms. Avoid over-optimising the period — consistency and confluence with price structure matter more than finding the 'perfect' number.
How do you combine RSI overbought oversold with support and resistance?+
The highest-probability RSI setups occur when the indicator reaches an extreme zone precisely as price tests a key structural level. An oversold RSI reading that coincides with a major support zone, a prior swing low, or a Fibonacci retracement gives you two independent reasons to expect a bounce. Volume confirmation adds a third layer — a spike in buying volume at an oversold support level alongside RSI curling up from below 30 is a setup worth sizing into. Without structural confluence, a raw RSI reading is just a number.
What RSI mistakes get traders eliminated in a prop challenge?+
The most common RSI mistake in a prop challenge is treating every overbought or oversold reading as an immediate reversal signal and counter-trending into strong momentum — this is how daily loss limits get hit fast. A second critical error is ignoring the broader trend context: shorting an overbought RSI in a raging uptrend on US100 during a risk-on week is a low-probability bet. In a Two-Step Challenge, capital preservation comes first — RSI signals should be filtered through trend direction and only traded when structural confluence is present.
How does RSI compare to MACD and Stochastic for spotting exhaustion?+
RSI measures the speed and magnitude of price change relative to a fixed lookback — it excels at flagging momentum exhaustion. MACD is a trend-following momentum indicator that works better for identifying trend continuation and crossovers than overbought/oversold conditions. Stochastic oscillates similarly to RSI but is more sensitive to short-term price swings, making it noisier on volatile instruments like gold. For identifying exhaustion specifically, RSI divergence is generally considered the cleaner signal; Stochastic can complement it on lower timeframes for entry timing.
Can RSI overbought oversold rules form a complete prop challenge system?+
RSI alone cannot form a complete system — it needs structural filters to survive a Two-Step Challenge. A workable rules-based framework combines RSI overbought/oversold zones with trend direction (only take counter-trend RSI signals when price is at a major structure level), divergence confirmation, and a fixed risk-per-trade rule (typically 0.5–1% of simulated account balance). Entry triggers on the RSI rollover from the extreme zone, not the initial breach. Stop placement uses recent swing structure, not a fixed pip distance. That combination gives the system enough edge and enough discipline to protect the account.
Written by
Marcel Hambálek
Senior Trader, For Traders
Marcel trades Futures and Forex day-trading setups on funded accounts and writes about the executional details most traders skip — order types, slippage, session timing, platform quirks on MT5 and NinjaTrader. Pragmatic, mechanics-first, no fluff.
Follow on LinkedInReady to trade funded capital?
Choose your path — Instant Accounts, One-Step or Two-Step Challenges — from just $49, with up to $300,000 in funded capital.
Choose your challengeTrade up to $300,000
Choose challenge