TradingView Scripts Every Funded Trader Should Know
10 TradingView scripts worth loading in 2026 — position sizing, drawdown trackers, BOS/FVG entries — with a scannable table, install steps and repaint checks.
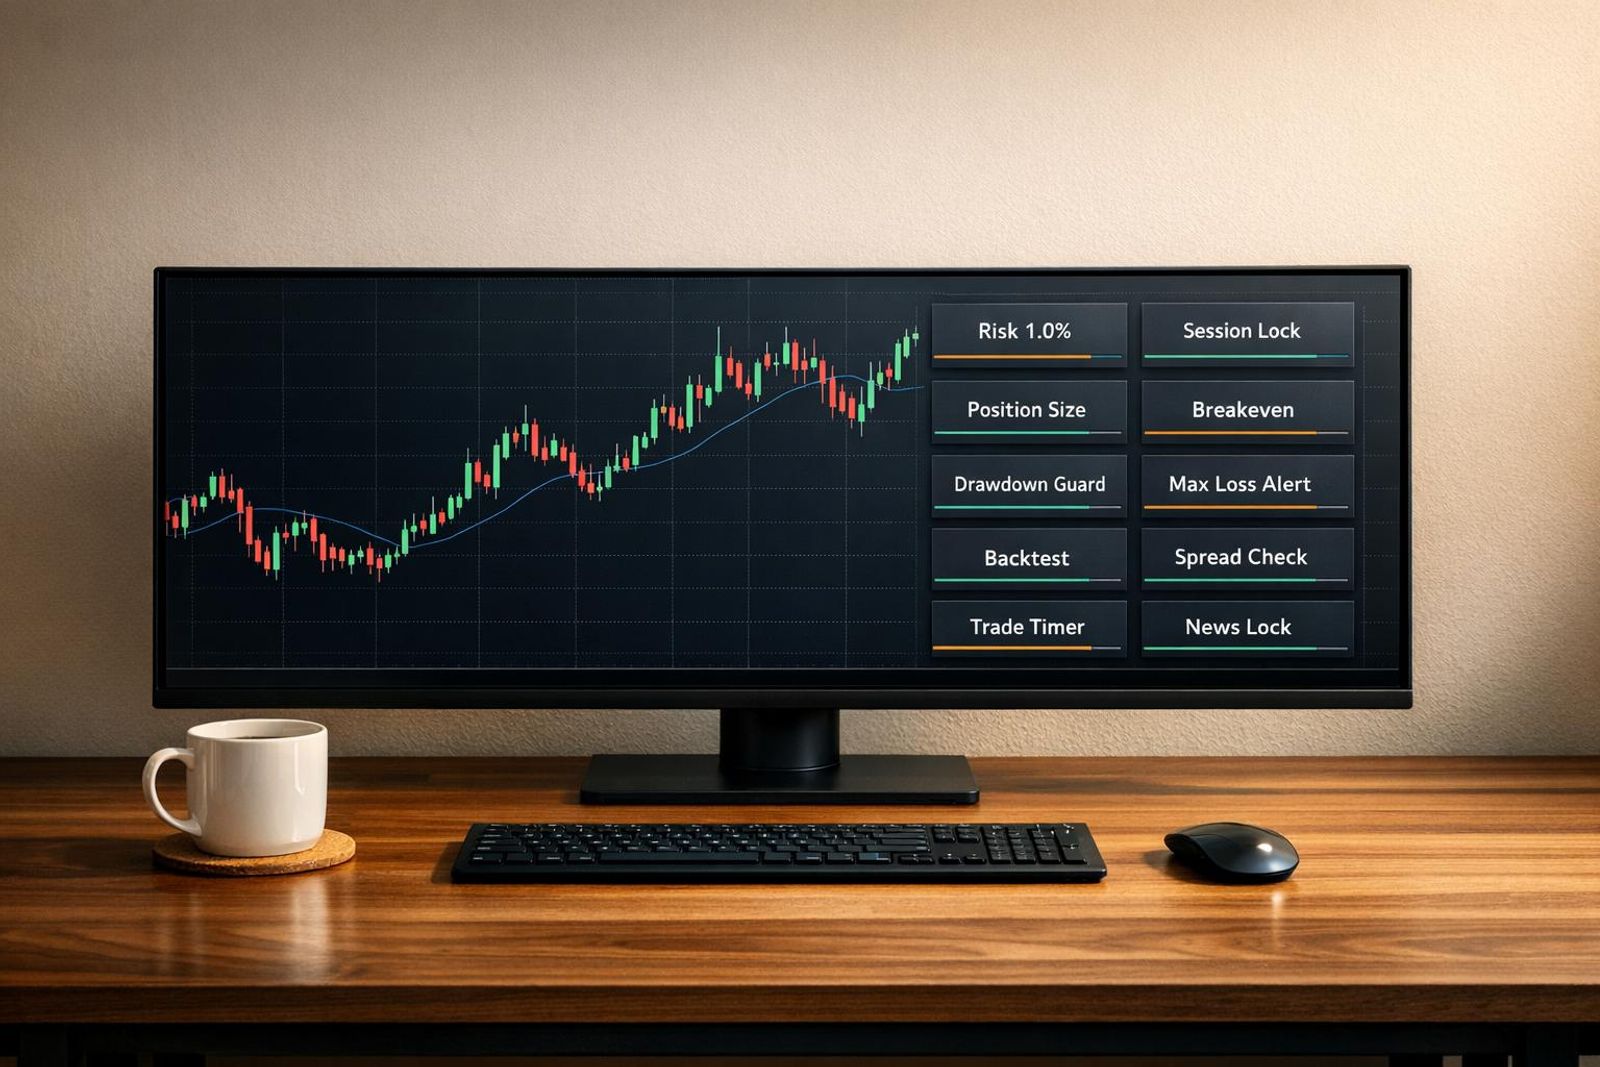
By Marcel Hambálek · Senior Trader, For Traders
TradingView scripts are custom tools written in Pine Script that run on your chart: indicators that plot information, strategies that simulate entries and exits in the Strategy Tester, and libraries of reusable code. Traders use them to automate levels, sizing and risk checks that are slow and error-prone to do by hand.
Key takeaways
- A TradingView script is Pine Script code — an indicator plots, a strategy backtests, a library is reusable code other scripts import.
- The single most useful script for a challenge account is a risk/reward position-sizing tool that draws entry, stop and target on one chart and outputs lot size from your risk in currency.
- Rule-enforcement scripts like drawdown trackers warn and calculate — they cannot block an order, so the discipline still has to be yours.
- Always stress-test a new script in Bar Replay before it touches a live evaluation; a Strategy Tester equity curve is not proof of anything.
- Repainting and look-ahead bias flatter backtests — three checks (bar close confirmation, security() lookahead, replay match) catch most offenders.
- Publishing your own Pine work opens invite-only access and paid coding gigs, but the honest reason to publish is that public code forces clean code.
Watch: related video
What TradingView Scripts Actually Are
A TradingView script is a piece of code written in Pine Script that runs on a chart to plot data, simulate trades, or package reusable logic — turning manual chart work into something automated and repeatable. If you're funded and trading XAUUSD or NSDQ on a tight daily loss limit, that automation isn't a gimmick, it's risk management you don't have to remember to do at 2am before FOMC.
Indicator vs strategy vs library in Pine Script v6
Pine Script v6 defines three distinct object types, and mixing them up wastes hours:
- Indicator — declared with indicator(), plots on or below price (moving averages, ATR bands, session opens). No order simulation, just visualization.
- Strategy — declared with strategy(), a pine script v6 strategy actually places simulated entries and exits and populates the Strategy Tester with equity curve, win rate, max drawdown and profit factor. This is where you backtest a setup before risking simulated capital on a challenge.
- Library — declared with library(), exports functions other scripts can import. No chart output of its own; it's infrastructure other traders build on.
Confusing an indicator for a strategy is the most common rookie mistake — an indicator will never show you a drawdown number because it never simulated a trade in the first place.
Where scripts live: Pine Editor and the Community Scripts library
Every TradingView chart has the Pine Editor docked at the bottom of the screen — that's where you write, edit, and debug a trading script line by line, then hit "Add to Chart" to test it live. You don't need to write anything from scratch to get started, though: the Community Scripts library holds several hundred thousand published tools, searchable by name, and most of what a funded trader needs (session boxes, ATR-based stop calculators, correlation panels for gold vs DXY) already exists there, free to add.
Free, open-source, protected and invite-only explained
Scripts on TradingView carry one of four access labels, and knowing the difference saves you from chasing something you'll never get:
- Open-source — full code visible, free to copy and modify. Best for learning Pine Script v6 syntax.
- Protected — free to use on your chart, but the underlying code is hidden. Common for free tradingview indicators the author wants to keep proprietary.
- Invite-only scripts — the author manually grants access, often after a subscription or community requirement. Code stays hidden and usage is gated.
- Private — visible only to the script's author, never published.
That four-way split is exactly what the next comparison table breaks down by cost, access, and use case.
The 10 Best TradingView Scripts at a Glance
Here's the short version: a session-and-killzone indicator, an ATR-based position sizer, a multi-timeframe trend filter, and a max-drawdown tracker cover most of what a funded account actually needs — the rest fill in gold-specific volatility reads and index-session timing. Load the table, pick what matches your rule set, skip the rest.
| Script Type | Job / Rule It Handles | Typical Access | Best Instrument |
|---|---|---|---|
| Session & Killzone Indicator | Marks London/NY opens, flags high-liquidity windows | Free | XAUUSD, US100 |
| ATR-Based Position Sizer | Auto-calculates lot size from stop distance and account risk % | Free | All assets |
| Multi-Timeframe Trend Filter | Confirms HTF bias before you take an LTF entry | Free / Invite-only | Indices, Forex |
| Max Drawdown Tracker | Plots live equity vs. daily loss limit and max DD line | Free | All assets |
| Volume Profile / VPVR | Shows where volume built up — value areas, POC | Free (built-in variant) | US100, futures |
| Gold Volatility Bands | ATR-scaled bands tuned for XAUUSD's wider ranges | Invite-only | XAUUSD |
| Breakout & Retest Scanner | Flags structure breaks and confirms pullback entries | Invite-only | Indices, Gold |
| Correlation Matrix | Warns when you're stacking correlated risk across pairs | Free | Forex, multi-asset |
| R:R & Trade Journal Overlay | Logs entry/exit, calculates realized R:R automatically | Free / Invite-only | All assets |
| News/Event Filter | Blocks or highlights bars around NFP, FOMC releases | Free | All assets |
How to read the table
The "Job" column is the only one that should drive your decision — match it to a rule you're already breaking or a calculation you're doing by hand under pressure. The "Typical Access" column tells you whether to expect a free tradingview indicator you can add in one click, or an invite-only script gated behind the author's community. "Best Instrument" isn't exclusive; a correlation matrix works everywhere, but a gold volatility band tuned to XAUUSD's average daily range will misfire on a tighter forex pair.
How these ten were chosen
We filtered candidates against four criteria specific to evaluation accounts, not general retail trading. First, rule relevance — does the script actually track something a funded challenge penalizes, like daily loss limits or correlated exposure, rather than just prettify price action. Second, usability on gold and indices specifically, since those are the instruments most funded traders lean on and where manual calculation (ATR-based stops on XAUUSD, session timing on US100) is slowest to do by hand. Third, whether a usable version exists without a paid subscription tier — we prioritized free tradingview indicators and scripts with a free baseline over ones locked entirely behind a paywall. Fourth, and most important: does the script do something a manual trader realistically can't replicate fast enough during a live session, like recalculating position size mid-volatility spike.
One honest caveat: access type isn't fixed. The same script concept — say, a breakout scanner — might exist as a free version from one author and an invite-only, subscription-gated version from another with better fill logic. Treat the access column as a general pattern across trading view scripts, not a guarantee for any single publication you find on the platform.
The Best Visual Script for Entry, Target and Stop on One Chart
The best visual script for this job is a tradingview risk reward script — a drag-and-drop position-sizing overlay that plots your entry, a red stop zone and a green target zone, then labels the box with risk in dollars, R multiple and the exact lot size to trade. You place it once, drag the handles to your levels, and it does the arithmetic you'd otherwise be doing on a calculator between candles.
What the risk/reward position-sizing tool actually draws
Drop the tool on the chart and you get three anchor points: entry line, stop line, target line. Move the stop handle and the red zone resizes live. Move the target handle and the green zone follows, updating the risk-to-reward ratio in the label above it. Most versions of this tradingview position sizing script let you set account size and risk percentage once in the settings panel — 1%, say — and it recalculates position size every time you touch a handle. You're not guessing whether a setup is "worth it" anymore; the box tells you before you click buy.
Reading the box: risk in currency, R multiple, lot size
The label output usually shows three lines, and each one matters for a different reason:
- Risk in currency — the actual dollar amount you lose if the stop fills, based on your account risk setting, not a guess.
- R multiple — how many multiples of your risk the target represents. A 1:3 setup means your green zone is three times the size of your red zone.
- Lot size — the position size that makes the currency risk true. This is the number that actually matters. A pretty 1:3 box means nothing if you fat-finger the lot size and risk 4% instead of 1%.
Why it beats dragging TradingView's built-in long position tool
TradingView's native long/short position drawing tool shows you the same coloured zones and calculates R:R on the fly — it's genuinely useful and free. But it doesn't size the trade to a fixed currency risk. It shows ratio, not risk. You can drag a beautiful 1:4 box on a XAUUSD chart and still be over-leveraged if you don't manually work out lot size against your account. A dedicated risk reward script closes that gap by tying the box directly to your account risk input, so the ratio and the sizing come from the same calculation instead of two separate mental steps — one of which gets skipped when you're rushing a fill before a news candle.
The sharper versions of this script skip the round-number stop entirely and use ATR instead — placing the stop at 1.5x to 2x ATR (Average True Range) off entry rather than the nearest round number, which tends to get swept by liquidity hunts before price reverses in your direction. If you're building or picking the best script for TradingView in this category, that ATR-driven stop logic is the detail worth checking before the coloured boxes.
Rule-Enforcement Scripts: Daily Loss, Max Drawdown and Overtrading
These are the scripts that matter most once you're inside an actual evaluation: they map straight onto the numbers that decide pass or fail — daily loss limit, max drawdown, trailing drawdown, and the overtrading spiral that follows a bad morning. Every one of them warns and calculates. None of them can block an order at the platform level — that part is still on you.
Prop Firm Business Simulator (Honestcowboy)
This one doesn't plot your equity curve — it plots your odds. Honestcowboy's Prop Firm Business Simulator runs your strategy's win rate, average R:R and position sizing across hundreds of simulated evaluation attempts, then shows you the distribution of outcomes: what percentage bust, what percentage pass, what the median payout looks like. It's built for anyone who wants to know, before risking an evaluation fee, whether their edge actually survives the pass/fail math of a challenge rather than the smoother math of a single backtest.
Prop Firm Guard (Daveatt)
Daveatt's Prop Firm Guard is a live gauge, not a backtest — it tracks your realised and floating P/L against your daily loss limit and flashes a warning zone as you approach it. If you're the type who trades fine until you're down 2% on the day and then starts revenge-clicking, this is the script that puts a visible wall in front of you before the platform's own risk engine does it for you at the worse possible moment.
Trailing drawdown tracker for futures-style rules
Static max drawdown is one calculation — a fixed floor under your starting balance. Trailing drawdown is a different problem entirely: the floor rises with your peak equity, so a green streak can quietly tighten your room to breathe. This is the default risk model on most futures challenges, and a pine script for prop firm rules built for equities won't handle it correctly unless it's specifically coded to track peak-equity, not starting balance. A dedicated trailing drawdown tracker recalculates that moving floor bar by bar and plots it next to price, so you see the real distance to breach — not the distance from where you started.
One-trade-at-a-time overtrading blocker
Overtrading after a loss is the single most common reason funded evaluations fail — more common than a bad trade thesis. This script logic greys out the chart or fires an alert the moment you already have a position open, forcing a pause before you stack a second, third or fourth setup on top of a losing day. It won't stop your finger on the trigger, but it puts friction exactly where impulse usually wins.
Taken together, these four form a decent core of tradingview scripts for funded traders sitting inside an evaluation: a prop firm drawdown tracker tradingview setup for the trailing math, a session-level guard for the daily loss limit, a simulator for your odds before you pay the fee, and a blocker for the moment your discipline usually breaks. None of them replace the discipline — they just make the numbers impossible to ignore.
Structure and Entry Scripts: Smart Money, Supertrend and Volume Profile
These three cover where you get in and where you get out — and only one of them tells you something price alone doesn't already show. The rest is context dressing that looks sharp on a chart but can just be redrawing what your eyes already see.
BOS + OTE + FVG + Order Block smart money suite
One script, four concepts stacked on top of each other: Break of Structure flags when price takes out a prior swing high or low, an Order Block marks the last opposing candle before that break, a Fair Value Gap shades the imbalance candle left behind by an aggressive leg, and the Optimal Trade Entry band shades the 0.705–0.79 Fibonacci retracement zone traders use to time re-entries into that gap. Most versions add a Killzone filter — London (roughly 07:00–10:00 GMT) and New York (12:00–15:00 GMT) sessions get highlighted, everything outside gets greyed out, so you're not tempted to force an OTE setup during the dead Asia chop. The value here is real: BOS and FVG give you objective structure instead of "I think this looks like a reversal," which matters a lot when you're staring down a daily loss limit and need a reason to skip a marginal setup.
Supertrend with ATR trailing stop and session auto-close
Supertrend plots a trailing line derived from ATR — typically a 1.5x to 2x multiple of average true range — that flips above or below price depending on trend direction. On gold, that multiple matters more than the setting itself: 2x ATR gives you room during a volatile London-NY overlap without getting stopped on noise, while 1.5x tightens up nicely through a quiet Asia session where spreads and range compress. The genuinely useful add-on is session auto-close logic that flattens the position ahead of your firm's daily reset window, so you're not carrying a Supertrend-driven trade into a rollover you didn't plan for. On its own the line is just a smoothed moving average with a fancy name — the auto-close is what earns it a slot on a funded chart.
Volume Profile: Point of Control and Value Area High/Low
Volume Profile plots where the actual volume traded, not where price sat — and the Point of Control (the single price level with the most volume) plus the Value Area High and Low (the band holding roughly 70% of session volume) work best as targets and rejection zones, not entry triggers. Price returning to a prior day's POC on light volume is a fade signal; price accepting above VAH on strong volume is continuation, not resistance. Treat it as a map of where liquidity actually sat, and it earns its place among the best tradingview scripts for structure — treat it as a signal generator and you'll misread half the touches.
Here's the honest split: BOS, FVG and Volume Profile add information you can't get from a naked candle chart. Supertrend, without the ATR context and auto-close logic, is close to redundant — it's a lagging trend filter wearing a better costume.
Sizing and R:R Scripts: The Maths That Keeps You in the Challenge
A tradingview position sizing script calculates your lot size in one line: account balance × risk percentage, divided by stop distance in points, divided by point value — with ATR feeding that stop distance so your size automatically shrinks when volatility expands. Get this wrong once on XAUUSD during a news spike and you can erase two weeks of clean execution in a single fill.
Position sizing visualiser: ATR, stop distance and account risk
The script plots a box on your chart before you enter: risk amount in currency, stop-loss level, and the exact lot size that keeps you within your risk cap. Feed it ATR(14) instead of a fixed pip count and the math adjusts itself — a wider ATR reading on gold during London-New York overlap means a wider stop, which means a smaller position size for the same dollar risk. This is the entire point of using tradingview risk reward script tools instead of eyeballing it: the calculator doesn't get emotional when the range expands.
The 3:1 R:R and 40% win rate maths
Here's the number that should be on a sticky note on your monitor: at a 3:1 risk-to-reward ratio, you only need a 40% win rate to grow the account. Six losses out of ten trades is still a passing month, provided the four winners were held to full target instead of scratched early out of nerves.
| R:R Ratio | Breakeven Win Rate | Wins Needed per 10 Trades |
|---|---|---|
| 1:1 | 50% | 5 |
| 2:1 | 33.3% | 4 (rounded up) |
| 3:1 | 25% | 3 |
| 3:1 (target for growth) | ~40% | 4 |
A tradingview risk reward script that logs every trade's realised R multiple in the Strategy Tester shows you exactly where you sit against that 40% line — not what you think your win rate is, what it actually is over the last 50 trades.
Why fixed-lot trading breaks trailing drawdown accounts
Fixed-lot trading — same 0.5 lots on every setup regardless of stop distance — is fine on a static account. It's lethal on a trailing drawdown account, because the drawdown floor moves up with your equity peak, and one oversized trade can chew through the entire buffer you spent two weeks building with disciplined 0.5% risk trades.
Worked example: your account is $50,000, you risk 0.5% ($250) per trade. On a clean trend day, ATR on XAUUSD reads 6.00 and your stop sits 8 points away — the script sizes you to roughly 0.31 lots. During NFP, ATR spikes to 18.00 and your stop needs 22 points of room to avoid the initial whipsaw. A trader running fixed 0.5 lots suddenly risks over three times their normal amount on that single trade — enough to trip the daily loss limit and dent the trailing buffer in one fill. The position sizing script would have cut that same trade to roughly 0.11 lots automatically, keeping the $250 risk constant no matter what the range did.
Ready to trade funded capital?
Choose your path — Instant Accounts, One-Step or Two-Step Challenges — from just $23, with up to $300,000 in funded capital.
Choose your challengeBacktest and Review Scripts: Bar Replay Before Real Rules
Bar Replay is TradingView's built-in time machine — it lets you step through historical price bar by bar without seeing what comes next, which makes it the closest thing to a free, honest forward test you'll find. Before you load any new script onto a live challenge account, run it through Bar Replay first. If the script can't survive a blind walk through old data, it has no business touching real evaluation rules.
Using Bar Replay as a manual forward test
Most traders use Bar Replay wrong — they scrub forward, see the outcome, then scrub back and pretend they didn't. That's not a test, that's hindsight with extra steps. The right way: pick a random start date, hide the right side of the chart mentally, and step one bar at a time. React only to what the script's plots and alerts tell you at that bar. This is the only way to know if your entry logic actually fires in real time or only looks clean once you know the resolution. A trading script that plots a perfect breakout signal in hindsight but hesitates or repaints in Bar Replay isn't a trading script — it's a chart decoration.
Strategy Tester settings that matter: commission, slippage, order size
If you're testing a pine script v6 strategy, the default Strategy Tester settings will lie to you. Three inputs traders leave untouched and shouldn't:
- Commission — default is often zero. Set it to what your broker or futures contract actually charges per side, not per round trip.
- Slippage — set in ticks, not percent. Two ticks of slippage on a scalping strategy with a 5-tick average target can turn a winning backtest into a losing one instantly.
- Order size — set as a percentage of equity, not a fixed number of contracts. A fixed-size backtest doesn't account for compounding drawdown or growth, so the equity curve you're staring at isn't the one you'd actually trade.
Get these three wrong and your backtesting numbers are fiction dressed up as data.
Logging the results so the test means something
Push for a minimum of 100 replayed trades before a script gets anywhere near a funded evaluation, and make sure that sample spans both trending and ranging conditions — a script that only gets tested in one regime hasn't been tested, it's been confirmed. For each trade, log four things in a sheet: entry price, exit price, R multiple, and the reason the trade triggered. A script that looks great scrolled across the chart but ugly in the log — inconsistent R multiples, no clear reason repeating across wins — is a script that's flattering you, not helping you. The log doesn't care how clean the chart looked; it just tells you if the edge is real.
How to Add and Verify a Script in Under Two Minutes
Adding a script to your chart takes ten seconds. Trusting it with your funded evaluation should take longer — here's the sequence that closes the gap without turning it into a chore.
Step-by-step: from Community Scripts to your chart
- Click Indicators at the top of your chart (or hit the keyboard shortcut) to open the search dialog.
- Select the Community Scripts library tab rather than the built-in tab — this is where the free tradingview indicators and paid trading view scripts from independent authors live.
- Search by name or keyword, then sort by relevance and check the boost count and author profile before you click. A script with 50k boosts and years of published history has been stress-tested by more eyes than one posted last week with a dozen boosts.
- Click the script to preview it, then hit Add to chart.
Favourite, rename and set default inputs
Once it's on your chart, click the star icon next to the script name to favourite it — this pins it to your personal list so you're not re-searching Community Scripts every session. Rename it in your favourites if the default title is generic ("Supertrend v3" tells you nothing six months from now). Then open the gear icon and go through every input tab. Don't trade on the author's defaults: their ATR multiplier, lookback period and risk percentage were tuned for their account size and style, not yours. Set your own risk inputs — position sizing, stop distance, alert thresholds — before this script ever touches a live evaluation chart.
The two-minute sanity check before you trust it
Before it earns a permanent spot on your layout, run it through Bar Replay across at least one full session — ideally one with a news spike and a quiet range, so you see both regimes. Watch for repainting: does a signal that plotted on bar close move or disappear when you step forward? That's the single most common reason a backtest looks brilliant and live execution doesn't match it.
If the script is open-source, spend sixty seconds in the Pine Editor even if you don't code. You're not auditing the whole script — you're scanning for one specific red flag: a request.security() call with lookahead enabled. That single parameter is what lets a script "see" a higher-timeframe close before it's actually happened on your chart, which is exactly why backtests can look flawless and forward performance falls apart. If you spot it, treat every signal from that script as suspect until proven otherwise on Bar Replay.
One practical constraint worth knowing before you build a five-script setup: how many indicators can run simultaneously on one chart depends on your TradingView plan tier — free and lower-tier plans cap you well below what Pro-level subscriptions allow. Check your limit before you stack scripts, or you'll find out mid-session when the platform won't let you add the one you actually need.
Repainting, Look-Ahead Bias and Backtests That Lie
A repainting script redraws its own history, so the buy arrow you see on the daily candle from three weeks ago wasn't actually there when that bar was live. You back-test it, the equity curve looks flawless, you go live, and the same logic suddenly can't call a top or bottom to save itself. That gap between backtest and reality is the single biggest reason funded traders blow evaluation accounts on strategies that "worked" on the chart.
What repainting actually means on a live chart
Repainting indicators recalculate past values as new price data comes in, instead of locking a signal in once the bar that generated it has closed. There are three usual suspects:
- Signals plotted on the developing bar — the script fires mid-candle based on the current, unfinished price, then quietly shifts or deletes that signal once the candle closes somewhere else.
- Higher-timeframe data pulled with lookahead enabled — a 5-minute chart referencing the daily close before that daily bar has actually finished forming.
- Dynamic level redrawing — support/resistance, pivots, or supply-demand zones that shift retroactively as price action reveals "better" levels after the fact.
Look-ahead bias in request.security calls
Most higher-timeframe repainting comes down to one line of Pine Script: request.security(). If a script pulls a higher timeframe without the correct offset, it can hand your indicator information from a bar that hasn't closed yet — classic look-ahead bias. If the source code is open, search for request.security and check whether the call uses a confirmed, closed-bar reference or the raw current-bar value. This one line has probably ruined more live-forward test results than any risk management mistake.
A three-check verification routine
- Run it in Bar Replay. Step through history bar by bar and watch whether signals appear and stay fixed at the same location as they show on the fully-loaded chart. If arrows jump around as you replay, you've found your repaint.
- Check the settings for barstate.isconfirmed or a bar-close toggle. Scripts built to avoid repainting usually expose this as an input or hard-code the check — it means the signal only fires once the bar is fully closed, not while it's still forming.
- Read the request.security line if the code is public. You don't need to write Pine Script v6 strategy code yourself — you just need to spot whether the higher-timeframe pull respects bar close or not.
One more caveat before you trust any equity curve: the Strategy Tester's default settings assume zero slippage and perfect fills on every order. That's not how a gold breakout fills during a Nonfarm Payrolls minute, when spreads widen and your order queues behind everyone else's. Stress-test with realistic commission and slippage inputs before you size a live challenge account around a backtest number.
Running Scripts on a Challenge Chart: The Honest Trade-Off
Pros
- Position sizing is calculated in one click instead of guessed under pressure
- Daily loss and drawdown proximity is visible before you place the next trade, not after
- ATR-based stops adapt to gold and index volatility without manual recalculation
- Bar Replay plus Strategy Tester gives you a structured way to reject bad ideas cheaply
- Session filters and one-trade-at-a-time logic directly attack overtrading, the top failure cause
Cons / risks
- No script can block an order — every enforcement tool is a warning, not a wall
- Repainting and default Strategy Tester settings make weak scripts look profitable
- More than three or four overlays slows execution and invites signal shopping
- Invite-only scripts cost money with no way to verify the code before you pay
- Futures-style trailing drawdown needs a different tracker than a static max DD account
Ready to trade funded capital?
Choose your path — Instant Accounts, One-Step or Two-Step Challenges — from just $23, with up to $300,000 in funded capital.
Choose your challengeFrequently Asked Questions
What is a TradingView script?+
A TradingView script is code written in Pine Script that runs on your chart to plot indicators, automate strategy logic, or share reusable functions with other coders. Indicators just visualize data — moving averages, volume profiles, order blocks. Strategies go further and simulate trades with entries, exits and equity curves you can backtest. Libraries are code building blocks other script authors import rather than something you'd add to a chart directly. Every script is either open-source, protected (hidden logic, visible output), or invite-only, and that access level tells you a lot about how much you can actually verify before trusting it.
Are TradingView scripts free to use?+
Most Community Scripts are free — you add them from the public library with no cost. Some authors monetize through invite-only scripts, where you pay a subscription or one-time fee and the author grants your username access; this is common for advanced order-flow, session-liquidity, or auto-fibonacci tools. A free script and a paid one aren't automatically better or worse — the deciding factor is whether the logic is transparent enough to verify against price action, not the price tag. Plenty of free scripts on the platform outperform paid ones simply because their code is open and battle-tested by thousands of users.
Which TradingView scripts help most during a prop challenge?+
Scripts that reinforce risk discipline — position-size calculators, session/kill-zone highlighters, and daily-loss-limit trackers — tend to matter more than fancy entry signals when you're inside an evaluation. A script showing your remaining daily drawdown buffer next to live price keeps you from taking the one extra trade that busts the account. Volatility filters (ATR-based) also help you size correctly on XAUUSD versus a slower FX pair. None of these replace a trading plan; they just make the numbers from your Two-Step Challenge or Instant Funding account impossible to ignore mid-session.
Can a script enforce my daily loss limit automatically?+
A Pine Script indicator can display your daily loss limit and warn you visually or with an alert, but it cannot physically block an order — that enforcement happens on the platform's trading server, not on your chart. Some traders pair a visual drawdown tracker with a broker-side EA or manual discipline to actually stop trading once the line is hit. Treat any on-chart drawdown script as an early-warning system, not a safety net. The account rules — daily loss limit, max drawdown, trailing drawdown — are enforced by For Traders' systems regardless of what your chart shows.
How do I tell if a TradingView script repaints?+
A repainting script changes its past signals after the fact, so what looked like a perfect entry on the backtest never actually existed in real time. Check this by loading the script on a live chart, noting a signal, then refreshing or moving forward a few bars — if that arrow or dot shifts or disappears, it repaints. Reading the open-source code for `barstate.isconfirmed` or lookahead settings is the fastest way if the script is public. Never trust a backtest equity curve without first ruling out repainting; it's the single most common reason a Community Script looks brilliant in review and useless live.
Do TradingView scripts work for futures prop challenges with trailing drawdown?+
Yes, scripts can be adapted for trailing drawdown accounts, but you need one built specifically for that mechanic rather than a static daily-loss version. Trailing drawdown moves with your account's peak equity, so a useful script recalculates the floor tick-by-tick and flags it on-screen — critical on fast-moving futures like NQ or ES where a few ticks separate discipline from a blown account. Most default risk scripts assume a fixed daily reset, which is the wrong model for trailing-drawdown futures evaluations, so verify the script's logic matches your specific challenge type before relying on it.
How many indicators or scripts should be on one chart?+
Three to five purposeful scripts is the practical ceiling before they start conflicting with each other and slowing your decision-making. Every additional overlay adds a fraction of a second of hesitation at the exact moment you need to pull the trigger on a breakout or cut a loser. A clean setup usually pairs one trend/context tool, one volatility or risk-sizing script, and one execution-level marker (entry/stop/target). If you're checking four different indicators to convince yourself a trade is valid, that's not confluence — that's doubt, and no script fixes hesitation.
What can't a TradingView script fix in your trading?+
A script can't fix hesitation, revenge trading, or the urge to move a stop-loss hoping price comes back — those are discipline problems, not chart problems. Even a perfectly coded strategy backtest with a strong R:R and low drawdown will lose money in your hands if you override its signals under stress. Scripts are tools for clarity and speed, not substitutes for a trading plan you actually follow. The traders who pass a Trading Challenge tend to use fewer, simpler scripts and spend the saved attention on executing their rules consistently, not hunting for a better indicator.
Can you earn money from TradingView script monetization?+
Script authors can monetize through invite-only access, charging users a subscription or fee for a private script, or by building a following that converts into paid tools and courses. This is separate from trading itself — it's a coding/publishing revenue stream, not a guaranteed income source, and TradingView takes a share depending on the plan. Most successful script authors have years of Pine Script experience and a track record of open-source contributions that built trust first. It's a legitimate side path for skilled coders, but it shouldn't be confused with the performance rewards earned from passing a funded evaluation.
Written by
Marcel Hambálek
Senior Trader, For Traders
Marcel trades Futures and Forex day-trading setups on funded accounts and writes about the executional details most traders skip — order types, slippage, session timing, platform quirks on MT5 and NinjaTrader. Pragmatic, mechanics-first, no fluff.
Follow on LinkedInReady to trade funded capital?
Choose your path — Instant Accounts, One-Step or Two-Step Challenges — from just $49, with up to $300,000 in funded capital.
Choose your challengeTrade up to $300,000
Choose challenge