Risk Reward Ratio Calculator
Use this risk reward ratio calculator to turn entry, stop-loss and take-profit into an R:R — then see the exact win rate that ratio needs to break even.
By Marcel Hambálek · Senior Trader, For Traders
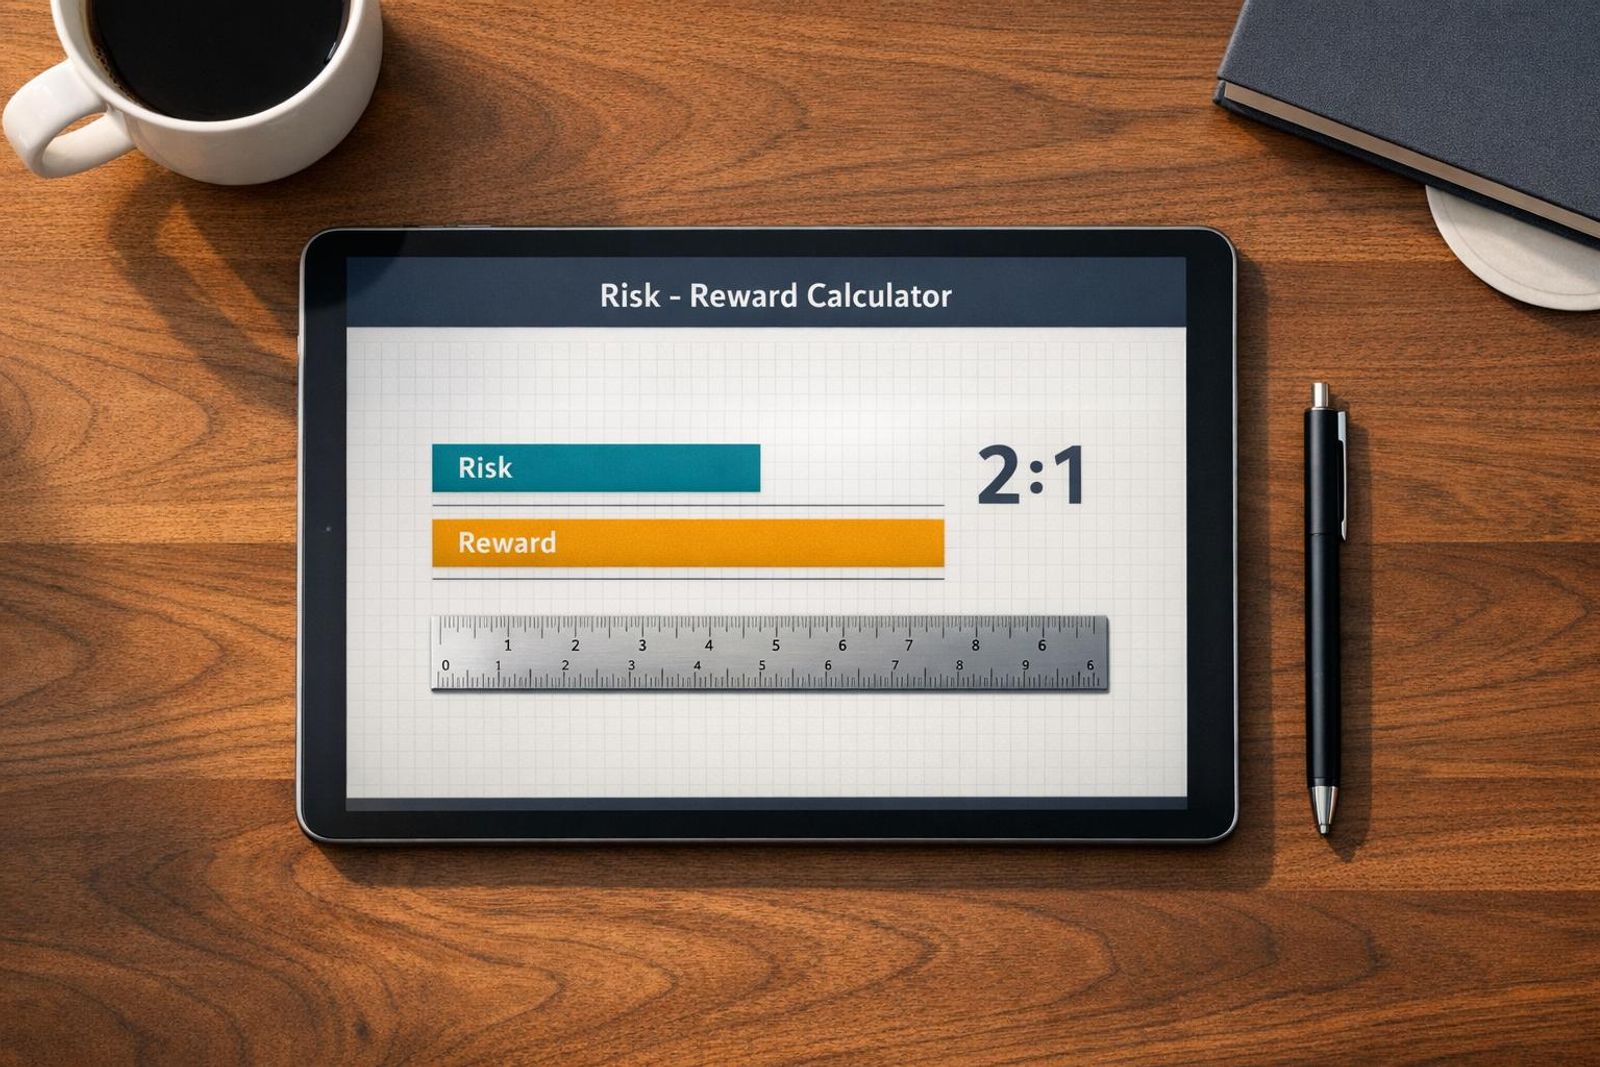
A risk reward ratio calculator turns three numbers — entry, stop-loss and take-profit — into one: Risk = |Entry − Stop|, Reward = |Target − Entry|, R:R = Reward ÷ Risk. A trade entered at 2,400 on gold with a stop at 2,390 and a target at 2,420 risks 10 to make 20, a 2:1 ratio that only needs a 33.3% win rate to break even before costs.
Key takeaways
- The risk-reward ratio formula is Reward ÷ Risk, where risk is the distance from entry to stop and reward is the distance from entry to target — the unit (pips, points, ticks, dollars) does not matter as long as both sides use the same one.
- Every ratio carries a breakeven win rate: 1:1 needs 50%, 2:1 needs 33.3%, 3:1 needs 25% and 5:1 needs 16.7% — a ratio is only 'good' if your actual hit rate clears that line.
- The ratio alone tells you nothing about money at risk; position size (pip value, lot size, tick value) converts R:R into the dollar amount your account actually feels.
- Spread, commission and slippage shave planned R:R into realised R:R — a 2:1 on paper routinely lands as 1.7:1 after costs on tight stops.
- ATR-based stops and targets produce ratios that are reachable; round-number levels produce ratios that look great and never fill.
- Inside a prop evaluation, the max drawdown and daily loss limit cap risk per trade — a 1.5:1 with a 55% hit rate usually clears a challenge where a 5:1 lottery ticket does not.
Watch: related video
The risk reward ratio formula (and how to do it in your head)
Here's the whole formula in one line: Risk = |Entry − Stop|, Reward = |Target − Entry|, R:R = Reward ÷ Risk. That's it. A risk reward ratio calculator doesn't do anything smarter than this — it subtracts two prices twice and divides the results. Once you understand how to calculate risk reward ratio manually, the tool above just saves you the arithmetic when you're watching five charts at once and don't have time to pull out a calculator app.
The three inputs: entry, stop-loss, take-profit
Every risk reward ratio formula runs off three prices you should already have before you click buy or sell:
- Entry price — where you actually get filled, not where you planned to get filled. Slippage on a fast market moves this number.
- Stop-loss — your invalidation level, the price that proves the setup wrong.
- Take-profit — your target, ideally sitting at a level with some technical reason behind it (prior structure, a measured move, a round number liquidity tends to react to).
Subtract entry from stop for your risk distance. Subtract entry from target for your reward distance. Divide reward by risk. A risk reward calculator just automates this so you can test five entries in the time it takes to type one.
Why the unit doesn't matter — pips, points, ticks or dollars
The ratio is unit-agnostic, but both distances must share the same unit or the math is garbage. Pips on EURUSD, dollars-per-ounce on XAUUSD, index points on US100, ticks on ES futures — pick one and use it for both legs of the trade. The single most common error we see traders make mid-session is mixing units: measuring risk in pips and reward in dollars because one leg came off a different chart timeframe or a different quote convention. The ratio doesn't care what asset you're trading — it cares that 10 of something on the risk side gets compared to 20 of that same something on the reward side.
The 10-second mental shortcut
You don't need the calculator for a quick gut-check. Take the bigger distance, divide it by the smaller one, and read the result as "x to 1." Stop is 15 points away, target is 45 points away — 45 ÷ 15 = 3, so it's a 3:1 setup. Stop is 8 ticks, target is 20 ticks — 20 ÷ 8 = 2.5:1. Round to the nearest half-point in your head and you'll be accurate enough to decide whether the trade clears your minimum threshold before you've even finished drawing the lines.
And the ratio works identically whether you're long or short — both distances are absolute values, so direction never enters the formula. A short with entry at 2,400, stop at 2,410, target at 2,370 risks 10 to make 30, a clean 3:1, calculated exactly the same way as the long version.
How to calculate risk reward ratio in 5 steps
To calculate risk reward ratio: mark your entry, place your stop at the level that proves the trade idea wrong, set your target at the next realistic liquidity pocket, then divide reward by risk. Run that math before you click buy, not after. We'll carry one live example through all five steps — a EURUSD long at 1.0850, stop at 1.0820, target at 1.0920 — so you can see exactly where each number comes from.
Step 1-2: mark the entry and place the stop where the idea is wrong
Step 1 is your entry — the actual fill, not the price you wished you'd gotten. Slippage happens; plan from where you're actually in, not where the setup first flashed. In our example, entry is 1.0850.
Step 2 is stop-loss placement, and this is where most traders quietly sabotage the ratio before they've even started. The stop doesn't go at a round number or a fixed 20-pip count because that's "your risk tolerance." It goes at the structural level where the trade idea is proven wrong — below the swing low, beyond the order block, past the level that invalidates the setup. For this EURUSD long, that's 1.0820, a prior structure low. Risk = |1.0850 − 1.0820| = 30 pips.
Step 3-4: set the target at a level price can actually reach, then divide
Step 3: set your target at the next liquidity pocket or measured move — a prior high, a round-number cluster, a Fibonacci extension that lines up with actual resistance. Not "2x my risk because that sounds disciplined." Here, 1.0920 lines up with a prior swing high and session resistance. Reward = |1.0920 − 1.0850| = 70 pips.
Step 4 is the division every risk to reward ratio calculator automates: R:R = Reward ÷ Risk = 70 ÷ 30 = 2.33:1. That's the number you're trading — not an approximation, not "roughly 2:1." For trade planning purposes, know it to two decimals, because that precision is what separates a trade that clears your minimum threshold from one that quietly falls short.
Step 5: sanity-check the ratio against your win rate before you click
A 2.33:1 ratio needs a breakeven win rate of 1 ÷ (1 + 2.33) = 30%. Pull up your trading journal. If your EURUSD long setups land above 30% historically, this trade has positive expectancy before you even factor in your edge beyond breakeven. If your journal shows you win this setup type 25% of the time, the ratio looks good on paper but the math says you're still bleeding out long-term — take the trade anyway and you're gambling, not trading.
Notice the order matters: stop first, target second, ratio last. Traders who reverse it — picking a juicy-looking ratio first, then stretching the stop to make it fit — are the ones who end up invalidated by normal volatility two pips before price reverses in their favor. The stop defines where you're wrong. Everything else is arithmetic.
What is a good risk reward ratio? Pair every ratio with its breakeven win rate
A good risk-reward ratio is one whose breakeven win rate sits comfortably below the hit rate you actually produce at that distance. There's no universal "good" number — 2:1 is a sane default because it only needs a 33.3% win rate to break even, but a 5:1 ratio you hit 15% of the time is worse than a 1:1 you hit 55% of the time. The ratio means nothing on its own; it only means something next to your win rate.
Breakeven win rate table: 0.5:1 to 5:1
The formula is simple: Breakeven win rate = 1 ÷ (1 + R:R). Run that across the common ratios traders use and you get a breakeven win rate calculator you can hold in your head:
| Risk:Reward | Breakeven win rate | What it means |
|---|---|---|
| 0.5:1 | 66.7% | Scalp-style — needs a very high hit rate |
| 1:1 | 50% | Coin-flip math, pure win-rate dependent |
| 1.5:1 | 40% | Common swing-trade target |
| 2:1 | 33.3% | The default benchmark |
| 3:1 | 25% | Trend-following territory |
| 5:1 | 16.7% | Rare, big-leg trades — low hit rate acceptable |
Why 2:1 became the default benchmark — and when it's wrong
A 2:1 risk reward ratio spread became the industry's go-to because 33.3% is an achievable bar for most systems with a real edge — you can be wrong two-thirds of the time and still come out ahead before costs. That's why it's baked into so many funded-account risk rules. But it's a benchmark, not a law. If your strategy's actual win rate at 2:1 distance is 20% — because your target sits past the next resistance zone more often than not — you're bleeding R every month regardless of how clean the ratio looks on paper. Check your own trade log against the table above before you assume 2:1 is "good" for you.
Expectancy: the formula that decides whether the ratio pays
Ratio and win rate only become useful together through the trading expectancy formula, expressed in R so it works identically on XAUUSD, NSDQ futures, or a crypto perpetual:
Expectancy = (Win% × Avg Win) − (Loss% × Avg Loss)
Take a 45% win rate at 2:1: Expectancy = (0.45 × 2R) − (0.55 × 1R) = 0.90R − 0.55R = +0.35R per trade. Run that through 100 trades at consistent position sizing and you've got a real, measurable edge — not a hunch. This is the same logic behind any R multiple calculator worth using: it strips the dollar signs out and tells you whether the system pays, independent of the instrument or your account size.
The honest caveat: a disciplined 1.5:1 beats an undisciplined 3:1 every month of the year. The ratio is arithmetic; expectancy is truth. If you want the full mechanics of how win rate, ratio, and position sizing interact over a sample of trades, the deeper risk-reward explainer walks through it trade by trade.
Risk ratio vs risk-reward ratio vs reward-to-risk: same math, different label
Whether you search "risk ratio calculator," "risk/reward ratio calculator," or "risk to reward ratio calculator," you land on the same arithmetic: divide the distance to your target by the distance to your stop. The label changes, the formula doesn't.
Why 'risk ratio calculator' and 'risk/reward ratio calculator' return the same tool
Traders shorten the phrase differently depending on where they learned it. "Risk ratio" is the lazy version. "Risk/reward ratio" is the textbook version. "Reward to risk ratio" flips the emphasis toward the upside. None of these are different metrics — they all compute Reward ÷ Risk using the same three inputs: entry, stop-loss, and take-profit. If a tool asks for those three numbers, it's doing the same job no matter what the page title calls it.
Reading 1:2 vs 2:1 without getting it backwards
This is where traders actually lose money through misreading, not mis-calculating. Some platforms write risk first: 1:2 means risk 1 unit to make 2 — a favorable setup. Others write reward first: 2:1 means make 2 while risking 1 — the identical trade, opposite notation. There's no universal standard, so don't trust the order of the numbers. Trust the size. Whichever number is larger is always the reward side. A 1:3 and a 3:1 can describe the same trade depending on which convention the platform uses — check it once per tool, then move on.
Where R-multiples replace the ratio entirely
Once you're logging dozens of trades across gold, NSDQ futures, and crypto, the ratio notation starts to wobble because position sizes and account currencies differ trade to trade. The R-multiple fixes that. Define 1R as your risk unit — the dollar amount you're risking on that specific trade, already sized to your stop distance. A 2:1 winner banks +2R. A stopped-out trade is always −1R, whether it's XAUUSD, a Nasdaq future, or a BTC perpetual. The instrument and account size stop mattering because R has already absorbed them.
This is why professional trading journals log R, not percentages or dollar P&L, as the primary unit. A string of trades reading +2R, −1R, −1R, +3R, −1R tells you the system's edge in one glance — no mental conversion needed across symbols. Run the same sequence through a risk reward ratio calculator for each trade first to confirm your R is consistent before you start summing it, because an R-multiple built on a sloppy stop distance is just a wrong ratio wearing a cleaner label.
Turn the ratio into a position size: from R:R to lot size
A ratio by itself risks nothing and makes nothing — it's a shape, not a dollar amount. A 2:1 R:R on a 0.01 lot and a 2:1 R:R on a 5 lot are the same geometry with wildly different consequences for your account. Position size is what converts the ratio into actual dollar risk, and that's where a risk reward and position size calculator earns its keep over a plain R:R tool.
Dollar risk first: the 1% rule and what it means on a 100k account
Before you touch a lot size field, decide your dollar risk per trade. The standard is 0.5%–1% of account equity. On a simulated $100,000 funded account, 1% is $1,000 of dollar risk per trade — that's your ceiling, full stop, regardless of how wide or tight the stop ends up being. This number stays fixed; everything else (stop distance, instrument, lot size) flexes around it.
Pip value, point value and tick value explained
To go from dollar risk to size you need to know what one unit of price movement is worth:
- Forex pip value — roughly $10 per pip per standard lot (100,000 units) on most USD-quoted majors like EURUSD, GBPUSD.
- XAUUSD — gold moves in dollars-per-ounce; a standard lot (100 oz) means $1 of price movement equals $100 of exposure, so a $10 stop on a standard lot is $1,000 at risk.
- US100 CFDs — valued per index point, with point value set by your broker's contract size (commonly $1–$20 per point depending on lot size).
- CME futures — fixed by the exchange. On the E-mini S&P (ES), tick value CME futures contracts is $12.50 per tick (0.25 points), or $50 per full point.
The position size formula: Risk $ ÷ (Stop distance × value per unit)
Once you have dollar risk and the instrument's value per unit, position sizing is one division:
Lot/contract size = Dollar risk ÷ (Stop distance × value per unit)
Example: $1,000 risk, gold stop of 10 points, standard lot worth $100/point → $1,000 ÷ (10 × $100) = 1 standard lot. Widen that stop to 20 points for a volatile NFP session and the same $1,000 risk now buys you only 0.5 lots — the ratio on the trade can stay 2:1, but the size shrinks to keep dollar risk constant. That's the whole discipline: the R:R stays the compass, position size is the throttle.
Run the inputs through our risk management calculator or the trading risk calculator to get exact lot sizes across forex, gold, indices and futures without doing the arithmetic by hand every session.
Worked examples: XAUUSD, US100, EURUSD and ES futures
Run these four trades through your own risk reward ratio calculator and you'll see the same math, four different ways of pricing risk — ounces, index points, pips, and ticks. The ratio logic never changes; only the unit the market uses to express it does.
Gold (XAUUSD): dollars per ounce
Long XAUUSD at 2,400, stop at 2,388, target at 2,436. Risk = 12 points ($12/oz), reward = 36 points ($36/oz), a clean 3:1. Gold trades in dollars per ounce per lot (100 oz standard), so 12 points of risk = $1,200 per standard lot. If your max risk per trade is $1,000, you're not trading a full lot — you're trading 0.83 lots. That's the core reason risk reward ratio gold XAUUSD trades get mis-sized so often: traders anchor on "1 lot" as a default instead of backing into size from the stop distance.
US100 / NSDQ: index points
Long US100 (NSDQ) at 20,450, stop at 20,390, target at 20,570. That's 60 points of risk against 120 points of reward — 2:1. On most platforms US100 is quoted at $1 per point per standard contract (confirm your broker's point value before sizing), so 60 points risk = $60 per contract. A $1,000 risk budget buys roughly 16-17 contracts at that point value, scaled down for whatever the platform's actual multiplier is.
EURUSD: pips
This is the same 1.0850 long / 1.0820 stop / 1.0920 target trade from the step-by-step above: 30 pips risk, 70 pips reward, 2.33:1. In a risk reward ratio forex context, one standard lot (100,000 units) moves roughly $10 per pip on EURUSD, so 30 pips risk = $300 per lot. A $1,000 budget sizes to roughly 3.3 standard lots — round down to 3 to stay inside the limit, never up.
ES futures: ticks
Long ES at 5,820.00, stop at 5,814.00 (24 ticks), target at 5,832.00 (48 ticks) — 2:1. ES futures tick value is fixed by the CME contract spec at $12.50 per tick (0.25 index points), so dollar risk = 24 ticks × $12.50 × contracts. One contract risks $300; a $1,000 budget allows 3 contracts ($900 risked) before you'd breach the limit with a fourth.
| Instrument | Entry | Stop | Target | Risk unit | R:R | $ risk @ 1 unit | Size @ $1,000 risk |
|---|---|---|---|---|---|---|---|
| XAUUSD | 2,400 | 2,388 | 2,436 | 12 pts ($12/oz) | 3:1 | $1,200/lot | 0.83 lots |
| US100 | 20,450 | 20,390 | 20,570 | 60 pts | 2:1 | $60/contract | ~16 contracts |
| EURUSD | 1.0850 | 1.0820 | 1.0920 | 30 pips | 2.33:1 | $300/lot | 3 lots |
| ES futures | 5,820.00 | 5,814.00 | 5,832.00 | 24 ticks | 2:1 | $300/contract | 3 contracts |
Notice gold's dollar risk per unit dwarfs the other three at identical point counts — that's wider average true range (ATR) doing exactly what it does, and it's why XAUUSD accounts for more blown evaluations on the platform than any other single instrument. Same discipline, smaller lot.
Ready to trade funded capital?
Choose your path — Instant Accounts, One-Step or Two-Step Challenges — from just $23, with up to $300,000 in funded capital.
Choose your challengeWhere the ratio quietly breaks: spread, commission and slippage
Costs are deducted from the reward side and added to the risk side, so a planned 2:1 commonly settles as roughly 1.7:1 once spread, commission and slippage are counted. Your calculator doesn't lie — it just doesn't know what your broker and the order book are about to charge you.
Run the arithmetic on a 20-pip stop with a 1.5-pip spread and $7 round-turn commission per lot. On a standard lot that's about $15 of commission plus 1.5 pips of spread baked into your entry — call it 1.5 extra pips of effective risk. On a 20-pip stop and 40-pip target, that's roughly 10-12% of your ratio gone before price has moved a single tick in your favour. Your "2:1" trade is functionally closer to 1.75:1 the moment you click buy.
Planned R:R vs realised R:R
Planned R:R is what your risk reward ratio calculator spits out from clean entry, stop and target prices. Realised R:R is what actually lands in your account after spread and slippage on entry, commission on both legs, and whatever slippage hits your exit. Track both numbers in your trading journal — side by side, trade by trade. If the gap between planned and realised is consistently wider than 10-15%, your cost structure is quietly eating your edge, not your strategy.
Why tight stops suffer the most
Trading costs are a fixed-ish dollar amount — spread and slippage don't scale with your stop distance. That means a 1.5-pip spread against a 10-pip stop is a 15% tax. The same 1.5-pip spread against a 100-pip swing stop is a 1.5% tax. Scalpers and tight-stop day traders need a structurally higher gross ratio — think 2.5:1 planned to net something like 2:1 realised — just to land where a swing trader sits comfortably at a planned 1.8:1. Same math, very different cost sensitivity.
Partial fills, gaps and the target that was "almost" hit
Slippage isn't random — it clusters around NFP and FOMC releases, when liquidity thins and spreads widen from 1.5 pips to 8-10 pips in a blink. A stop that should've filled at your level can execute 3-5 pips worse. On the reward side, you've seen the target that got "almost" hit — price taps 1.8R, reverses, and your trailing or limit order fills at 1.8R instead of the clean 2R you planned, because liquidity at the exact price wasn't there for your full size.
Build a cost buffer into the target rather than pretending the fill will be perfect. If you need 2R net, plan for 2.3R gross on tight stops and treat NFP/FOMC slippage as a cost of trading those windows, not a calculation error.
Set stops and targets with ATR, not round numbers
Put your stop 1.5× ATR beyond the invalidation level, not at the round number sitting a clean 50 pips or $10 away — that round number is exactly where the stop hunt lands. ATR average true range, measured over 14 periods on whatever timeframe you trade, tells you how far price actually travels on a normal day. It turns stop loss placement and target selection from a guess into something you can test and defend in your journal.
Sizing the stop at 1.5× ATR
Round numbers attract orders — stops, limits, algos all cluster there, which is exactly why price wicks through them before reversing. A stop at 1.5× ATR beyond your invalidation level (the swing low, the order block, the structure that actually breaks your thesis) sits in a spot the market has to genuinely move through, not just tag. On a gold setup where the 14-period ATR on the 1H is $9, that's roughly $13.50 of room beyond structure — not the tidy $10 the round number offers. Volatility-based stops cost you a few extra pips of risk per trade, but they stop you out on real reversals instead of liquidity grabs.
Checking the target against recent range, not hope
Once the stop is set, check your target the same way: is it realistic given how far price has actually moved over the last 10-20 sessions, or are you penciling in a number because the ratio looks good on the calculator? A realistic take-profit sits within one to two ATRs of normal daily travel from entry. Push it further than that and you're not forecasting — you're hoping the market delivers a move it rarely delivers inside your holding period. This is also where our risk reward ratio calculator earns its keep: run the ATR-based stop and a target capped at 1-2x ATR, and compare the resulting ratio against what the round-number version promised. The gap is usually bigger than traders expect.
When the ATR says the ratio isn't available — skip the trade
Some setups just don't have the room. If your invalidation level is 1.5× ATR away and the next real resistance (or support) sits only 0.8× ATR beyond entry, you're not looking at a 2:1 trade — you're looking at a 0.5:1 trade dressed up with an optimistic target. Skip it. There's no rule that says every setup has to be traded; there's a rule that says only trade the ones where the structure and the ATR agree.
XAUUSD volatility makes this filter non-negotiable rather than optional. Gold's ATR can double inside the hour around a US CPI or NFP print — yesterday's $9 ATR becomes $18 today, and the stop distance that made sense in Tuesday's session gets run over in Friday's. Recalculate ATR before every session, not once a week. This is exactly why 5:1 setups look spectacular in the calculator and rarely show up that way in the journal: the target was sized off yesterday's volatility, the market printed a different number today, and the trade timed out or reversed before reward ever caught up to risk.
Risk reward ratio inside a prop firm challenge
Your calculator doesn't know about max drawdown or the daily loss limit — and that's the rule traders miss. A 5:1 setup looks identical in the tool whether you're trading your own account or a funded evaluation, but the risk reward ratio for prop firm challenge trading isn't set by what looks attractive on a risk-reward chart. It's set by how much room the rules give you before the attempt ends.
How max drawdown and the daily loss limit cap your risk per trade
Most evaluations — including For Traders' — enforce two hard ceilings: a maximum drawdown (the total you can lose from your starting or trailing high-water balance) and a daily loss limit (a fixed percentage of starting balance you can't breach in a single session). Do the arithmetic before you size anything. If your daily loss limit is 4% and you take two losing trades at 2% each, you've burned the day's entire budget — no third shot, no revenge trade, no "it'll come back." That's why realistic risk per trade prop firm sizing typically lands between 0.5% and 1%, not the 2-3% you might risk on a personal account with nobody watching the clock.
Why 1.5:1 at 55% beats 5:1 at 18% in an evaluation
Run the expectancy formula on both systems and they can tie on paper. But an evaluation isn't an infinite backtest — it's a finite account with a drawdown floor that ends the game the moment you touch it. A 1.5:1 system winning 55% of the time grinds forward in small, frequent increments, rarely stressing the max drawdown. A 5:1 system at 18% spends long stretches underwater waiting for the one trade that pays for the previous four losers — and the drawdown rule doesn't care that the big winner was "due." It closes the account first. This is the core reason grinders pass more evaluations than swing-for-the-fences traders, even with a statistically identical edge.
Running the numbers on a Two-Step Challenge
Here's how the same $50,000 starting balance behaves under both approaches over a stretch of 40 trades, assuming a 4% daily loss limit and 1% risk per trade:
| Metric | 1.5:1 @ 55% win rate | 5:1 @ 18% win rate |
|---|---|---|
| Expectancy per trade | +0.325R | +0.30R |
| Max consecutive losses (typical) | 3-4 | 7-9 |
| Drawdown pressure | Shallow, recovers fast | Deep, lingers near max DD |
| Likely outcome in a Two-Step Challenge | Target reached with buffer | Max drawdown breached before payoff trade |
That's the honest case for testing your system against enforced rules rather than a spreadsheet. A For Traders Instant Funding account skips the evaluation phase entirely if you'd rather prove the ratio on a live funded structure from day one; the For Traders Two-Step Challenge gives you two phases to confirm the edge holds under both a profit target and a drawdown cap before performance rewards get paid on simulated profits. Either way, the goal is the same: find out if your ratio survives the rules, not just the backtest. For the planning side of this, see our guide on prop-trading risk-reward planning and the deeper breakdown of why risk-reward ratios matter in prop trading.
High R:R vs low R:R: the honest trade-off
Pros
- High ratios (3:1 and above) survive low win rates — 25% or less still breaks even at 3:1
- High ratios absorb spread and commission drag far better because the reward side is large relative to costs
- Low ratios (1:1 to 1.5:1) fill far more often, which keeps the equity curve smoother and the daily loss limit intact
- Low ratios produce more data faster, so you learn whether the edge is real within weeks rather than months
Cons / risks
- High ratios mean long losing streaks are mathematically normal — and a prop evaluation drawdown rule may end the attempt before the big winner lands
- High-ratio targets frequently sit beyond the instrument's realistic ATR range, so they look great in the calculator and never fill
- Low ratios demand a genuinely high hit rate — below 50% at 1:1 you are paying costs for the privilege of being busy
- Low ratios are punished hardest by spread, commission and slippage, which can erase a quarter of the edge on tight stops
Ready to trade funded capital?
Choose your path — Instant Accounts, One-Step or Two-Step Challenges — from just $23, with up to $300,000 in funded capital.
Choose your challengeFrequently Asked Questions
How do I calculate risk-reward ratio from entry and stop-loss?+
Subtract your stop-loss from entry to get risk in points, then subtract entry from take-profit to get reward, and divide reward by risk. On EURUSD, entry 1.1050, stop 1.1020 (30 pips risk), target 1.1110 (60 pips reward) gives you a 2:1 ratio. The same math works on XAUUSD in dollars-per-ounce or on futures in ticks — just keep the units consistent on both sides of the division. A risk reward ratio calculator does this instantly and removes rounding mistakes under pressure.
What is the risk-reward ratio formula?+
The formula is Risk-Reward Ratio = (Entry Price − Stop-Loss Price) ÷ (Take-Profit Price − Entry Price), expressed as a ratio like 1:2. For a short, flip the signs: risk is stop minus entry, reward is entry minus target. You can do it by hand in under 10 seconds once you know your three price levels — no calculator needed for a rough gut-check before you even open your platform. The harder part isn't the math, it's picking a stop and target that reflect actual structure rather than a round number.
What is a good risk-reward ratio to use?+
There's no universal 'good' ratio — 2:1 is a common benchmark because it only needs a 34% win rate to break even, but it's not automatically better than 1:1 if your strategy's edge comes from a higher hit rate. A scalping system built around tight, frequent wins might run 1:1 or even 0.7:1 profitably. A swing strategy riding trends might average 3:1 or higher. Judge the ratio against your backtested win rate and R-multiple distribution, not against a number you saw online.
What win rate do I need to break even at different R:R ratios?+
Break-even win rate equals Risk ÷ (Risk + Reward): at 1:1 you need 50%, at 1.5:1 you need 40%, at 2:1 you need 33.3%, at 3:1 you need 25%, and at 5:1 you need just 16.7%. These numbers ignore spread, commission, and slippage, so your real required win rate is always a bit higher. Track your actual win rate against your planned ratio for at least 30-50 trades before trusting the edge is real rather than a lucky sample.
What's the difference between a risk ratio calculator and risk-reward calculator?+
In practice traders use 'risk ratio calculator' and 'risk-reward ratio calculator' interchangeably to mean the same tool — the one that compares your potential loss to your potential gain on a trade. Some searches for 'risk ratio' actually mean position-sizing (how much capital to risk per trade based on account size and stop distance), which is a related but separate calculation. If you want both the ratio and the dollar amount at risk, use a calculator that takes account size, risk %, entry, stop, and target together.
How does risk-reward connect to position size?+
Risk-reward ratio tells you the shape of a trade; position size tells you how much money that shape is worth. If you risk 1% of a $50,000 account (a $500 risk) on a setup with a 30-pip stop, your position size is set so that 30 pips equals $500 — the R:R ratio then determines your target is 60 pips away for a $1,000 reward at 2:1. Change the stop distance and you must recalculate lot size to keep risk constant, even though the ratio itself might stay the same.
Can a risk-reward ratio be too high to be realistic?+
Yes in practical terms — a 5:1 or 10:1 setup looks great on paper but often needs price to travel so far that it rarely reaches the target before reversing, retracing, or hitting news-driven volatility that invalidates the setup. Wide targets also sit through more structure (resistance, prior highs, round numbers) that can stall price well short of your take-profit. A believable R:R should match what the instrument's typical daily or session range can actually deliver, checked against ATR, not just drawn on a chart because the math looks attractive.
How do spread and slippage affect my realised risk-reward ratio?+
Spread, commission, and slippage eat into both sides of the trade, so your realised R:R is almost always worse than your planned R:R. A planned 2:1 on a gold trade with a 30-cent stop and a $3 spread effectively shrinks your reward and widens your risk at entry and exit. On fast-moving instruments like XAUUSD or indices around news, slippage on stops can turn a clean 2:1 plan into something closer to 1.5:1 in practice. Always backtest with realistic costs, not theoretical fills.
How do I set stops and targets using ATR instead of round numbers?+
Multiply the Average True Range (ATR) by a factor — commonly 1.5x to 2x for a stop — and place it beyond that distance from entry, rather than at an obvious round number where retail stops cluster and often get hunted first. For a target, use the same ATR-based logic scaled to your desired ratio: a 1.5x ATR stop with a 3x ATR target gives you a clean 2:1 setup grounded in the instrument's actual recent volatility, not an arbitrary price level.
What risk-reward ratio works best in a prop firm evaluation?+
A ratio in the 1.5:1 to 2.5:1 range tends to suit most Two-Step or Three-Step Challenge structures, because it balances a workable win rate against the need to avoid breaching a max drawdown or daily loss limit from one or two bad trades. Chasing very high R:R setups to hit a profit target fast often means fewer trades qualify and variance spikes right when a single stopped-out trade could threaten your daily loss limit. Consistency within the rules usually beats swinging for outsized single-trade ratios.
Written by
Marcel Hambálek
Senior Trader, For Traders
Marcel trades Futures and Forex day-trading setups on funded accounts and writes about the executional details most traders skip — order types, slippage, session timing, platform quirks on MT5 and NinjaTrader. Pragmatic, mechanics-first, no fluff.
Follow on LinkedInReady to trade funded capital?
Choose your path — Instant Accounts, One-Step or Two-Step Challenges — from just $49, with up to $300,000 in funded capital.
Choose your challengeTrade up to $300,000
Choose challenge