Moving Averages: Simple vs Exponential Explained
Simple vs exponential moving average, quantified: weight decay, EMA half-life, best SMA periods, whipsaw math and the right setup for gold, indices and futures.

By Marcel Hambálek · Senior Trader, For Traders
A simple moving average (SMA) gives every bar in its lookback the same weight — 1/n each — while an exponential moving average (EMA) weights the newest close most heavily using a smoothing multiplier of 2/(n+1), so a 10-period EMA assigns 18.18% of its value to the latest bar alone. That makes the EMA turn faster and the SMA hold its line longer through noise; on a 50-period setting the EMA typically reacts to a trend change several bars before the SMA does.
Key takeaways
- SMA weights every bar equally (1/n); EMA applies a 2/(n+1) multiplier so recent closes dominate — that single difference explains every behavioural gap between them.
- The EMA's speed is measurable: its weight half-life is roughly 0.35 × n bars, meaning half a 20-EMA's value comes from the last seven bars, while a 20-SMA spreads it flat across all twenty.
- Faster is not better — EMAs generate more crosses per 100 bars, which means more early entries in trends and more whipsaws in ranges.
- SMA and EMA are only two of at least six practical moving averages; WMA, SMMA/RMA, HMA and VWAP each solve a problem neither of the first two can.
- Periods matter more than type: 50 and 200 work partly because institutions watch them, while 8/21 intraday settings are arbitrary and should be scaled to ATR and timeframe.
- In a prop evaluation, whipsaw frequency — not signal quality — is what breaches a daily loss limit, so position size has to assume consecutive false crosses.
Watch: related video
Simple vs Exponential Moving Average: The Short Answer
The simple vs exponential moving average debate comes down to weighting: an SMA treats every bar in its lookback equally, while an EMA leans hard on the newest close using a multiplier of 2/(n+1). That single design choice controls everything else — the EMA turns faster at trend changes, the SMA holds its line longer through noise, and the gap between them is your visual read on moving average lag in real time.
The one-line difference
An SMA is a flat average — add up the last n closes, divide by n, done. An EMA is a weighted average that never fully drops old data; it just fades it exponentially while stacking weight on the current bar. That's the whole moving average vs exponential moving average story in one sentence — everything downstream (lag, whipsaw risk, use case) is a consequence of that weighting scheme.
Side-by-side comparison table
| Factor | Simple Moving Average (SMA) | Exponential Moving Average (EMA) |
|---|---|---|
| Weighting scheme | Equal weight, 1/n per bar | Recency-weighted, 2/(n+1) on newest close |
| Lag profile | Higher lag, smoother line | Lower lag, reacts faster |
| Best market regime | Slow, steady trends; higher timeframes | Fast markets, momentum shifts, breakouts |
| Common periods | 50, 100, 200 (trend/institutional levels) | 9, 12, 21, 26, 50 (momentum/entries) |
| False-signal risk | Lower whipsaw, but late entries/exits | Higher whipsaw in choppy ranges |
| Typical use case | Long-term trend filter, support/resistance | Entry timing, crossover systems, MACD base |
| Computational quirk | Drops the oldest bar completely each step | Never fully forgets old data — old bars just decay toward zero weight |
That last row answers the "SMA vs EMA which is better" question more than most traders realize. The SMA's clean drop of the oldest bar is why it can hold flat through a fake pullback that would otherwise tug an average lower — the old high or low simply exits the window intact. The EMA's memory never fully clears, so a sharp move ten bars ago is still quietly influencing today's value, just at a fraction of its original weight.
What the difference actually looks like on a chart
Put a 50 SMA and 50 EMA on the same XAUUSD daily chart and watch how they behave, not just where they sit. When gold is grinding a clean trend, the two lines run almost on top of each other — that convergence tells you the trend is steady enough that recency-weighting and equal-weighting produce nearly the same answer. The moment the EMA pulls away from the SMA — angling up while the SMA lags flat below — that divergence is your early tell that momentum is accelerating before price confirms it with a breakout. Conversely, when price fakes a pullback and the SMA barely bends while the EMA dips sharply, that's the SMA's "never fully forgets the drop, but never overreacts either" character doing its job.
For the full mechanics — including how these lines combine with crossovers and multi-timeframe stacking — see our complete guide to moving averages, and browse the trading indicators hub for how SMA and EMA pair with oscillators and volume tools.
What a Simple Moving Average Is and How It's Calculated
The simple moving average definition is this: it's the arithmetic mean of the last n closing prices, recalculated fresh on every new bar. No weighting, no bias toward recent action — bar #1 in the lookback counts exactly the same as bar #10. That equal-weight character is what makes SMA calculation the most transparent of all the moving averages, and it's why chartists have leaned on it since long before EMA smoothing multipliers existed.
The simple moving average definition and formula
The SMA formula is:
SMA = (P1 + P2 + P3 + ... + Pn) / n
Where P is the price input (usually the closing price average for the period) and n is your lookback — 10, 20, 50, 200, whatever period you're testing. Each new bar shifts the window forward by one: the newest close enters the sum, the oldest one drops out. That rolling mechanic is the whole engine behind moving averages simplified to their core function — a running average that updates, bar by bar, forever.
A worked 10-period SMA example
Say you're running a 10-period SMA on daily closes for XAUUSD and your last ten closes are:
| Bar | Close ($) |
|---|---|
| 1 (oldest) | 2,015 |
| 2 | 2,022 |
| 3 | 2,031 |
| 4 | 2,028 |
| 5 | 2,040 |
| 6 | 2,055 |
| 7 | 2,048 |
| 8 | 2,062 |
| 9 | 2,071 |
| 10 (newest) | 2,079 |
Sum = 20,451. Divide by 10 and your SMA reads 2,045.1. Tomorrow, bar 1 (2,015) drops off and whatever the new close is gets added — the average shifts by exactly (new close − 2,015) / 10. That's the entire SMA calculation, no shortcuts, no decay.
Why the drop-off bar matters more than traders think
Here's the part most explainers skip: because the SMA is a rolling window, it can turn down on a completely flat trading day — purely because a big bar from ten sessions ago rolled off the back end. If bar 1 in the table above had been a 2,120 spike instead of 2,015, dropping it would yank the average down even if today's close barely moved. You're not seeing new selling pressure; you're seeing old data expiring. Traders who don't track what's about to roll off get caught interpreting a mechanical artifact as a signal.
Input choice matters too. Most platforms default to closing price, but median price ((high+low)/2) or typical price ((high+low+close)/3) smooth out single-tick anomalies — useful on choppier instruments. And on lower timeframes, weekend or session gaps (common on indices like US100 reopening after a weekend, or futures rolling sessions) can distort the SMA's read since the gap bar carries full weight in the average despite representing a discontinuity rather than genuine intrabar trading. Know your input and know your window before you trust the line.
How the EMA Works: The 2/(n+1) Multiplier and Its Half-Life
The exponential moving average calculation is recursive: every new value depends on the prior EMA plus a weighted slice of the newest close. The EMA smoothing multiplier 2/(n+1) controls how much weight that newest bar gets — larger for short periods, smaller for long ones. That single design choice is why the EMA reacts faster than a flat-weighted SMA, and why it never fully "forgets" a price no matter how far back it happened.
EMA formula explained with a 10-period walkthrough
The formula: EMAₙ = (Pₙ − EMAₙ₋₁) × [2/(n+1)] + EMAₙ₋₁, where Pₙ is the current close and EMAₙ₋₁ is yesterday's EMA value (or an SMA seed on the first calculation). For a 10-period EMA, the multiplier is 2/(10+1) = 0.1818 — meaning 18.18% of the new value comes from today's close, and 81.82% carries over from the prior EMA. Run it forward a few bars on XAUUSD and you'll see the line snap toward each new close far quicker than a 10-period SMA does, because that SMA treats every one of its 10 bars identically at 10% each.
Weight decay: what each of the last 10 bars actually contributes
Because the EMA is recursive, each prior bar's influence decays geometrically rather than dropping off a cliff after n periods like the SMA. Here's the actual bar-by-bar weight for a 10-period EMA versus the SMA's flat allocation — a breakdown most explainers skip entirely:
| Bars back | EMA(10) weight | SMA(10) weight |
|---|---|---|
| 0 (current) | 18.18% | 10.00% |
| 1 | 14.88% | 10.00% |
| 2 | 12.17% | 10.00% |
| 3 | 9.96% | 10.00% |
| 4 | 8.14% | 10.00% |
| 5 | 6.66% | 10.00% |
| 6 | 5.45% | 10.00% |
| 7 | 4.46% | 10.00% |
| 8 | 3.65% | 10.00% |
| 9 | 2.98% | 10.00% |
| 10+ (tail) | ~13.47% (spread to infinity) | 0% |
Notice the SMA weight simply stops at bar 10 — anything older contributes zero. The EMA's tail never hits zero; it keeps splitting an ever-smaller fraction across every bar back to the start of your dataset. Practically, that tail becomes irrelevant after a certain point, but mathematically the EMA is still "listening" to a print from months ago at some infinitesimal weight.
The half-life rule — how many bars behind price each MA sits
Half-life tells you how many bars it takes for a moving average to close half the gap to a new price level after a shift. For an EMA, that's roughly 0.35 × n bars. For an SMA, the equivalent center-of-mass lag runs closer to (n−1)/2 bars. Translated into real settings:
- n = 20: EMA half-life ≈ 7 bars vs SMA lag ≈ 9.5 bars
- n = 50: EMA half-life ≈ 17.5 bars vs SMA lag ≈ 24.5 bars
- n = 200: EMA half-life ≈ 70 bars vs SMA lag ≈ 99.5 bars
That's the moving average lag gap in concrete terms: on a 200-period setting, the EMA is catching up to a new trend roughly 30 bars sooner than the SMA. Whether that's an edge or a false signal generator depends entirely on the instrument and your crossover strategy rules — faster isn't automatically better, it's just a different trade-off you need to size your stops around.
The Rest of the Family: WMA, SMMA/RMA, HMA and VWAP
SMA and EMA get the headlines, but the different types of moving averages branch out further, and each one solves a specific problem the other two don't. If you're building an RSI, an ATR-based stop, or reading order flow on US100, you're already using one of these without necessarily calling it by name.
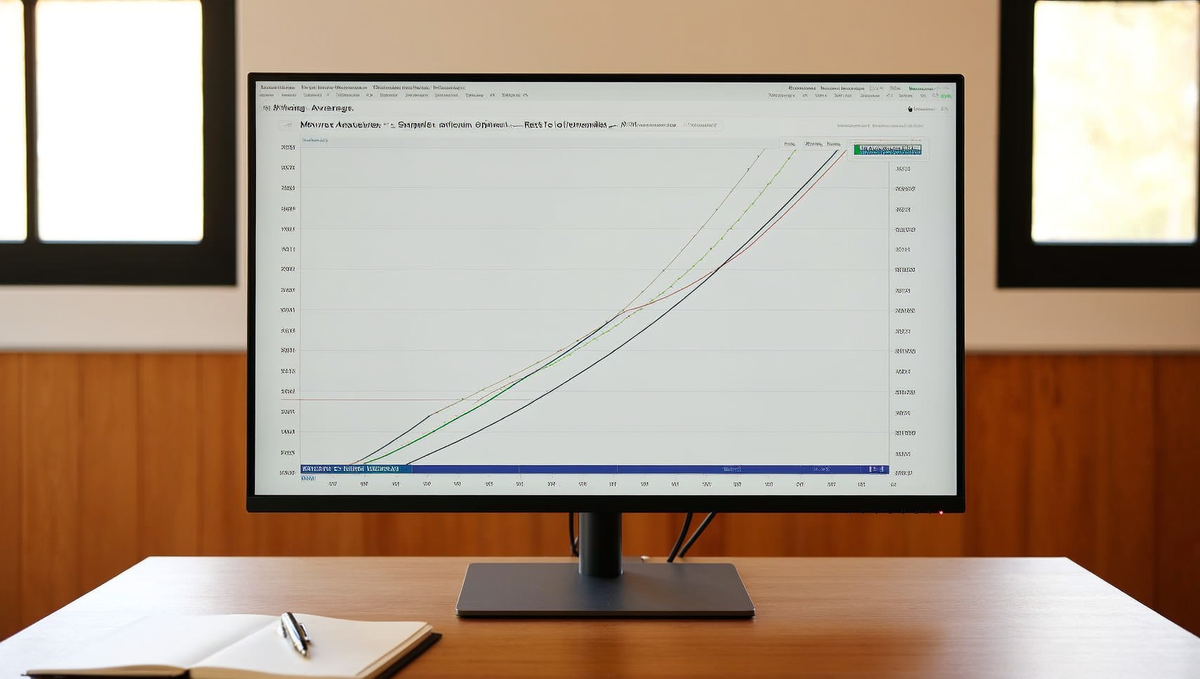
Weighted Moving Average (WMA)
The WMA assigns weight linearly — the most recent bar gets the highest multiplier, the oldest bar in the lookback gets the lowest, and every bar in between steps down proportionally rather than exponentially. On a 10-period WMA, bar 10 might carry a weight of 10/55 while bar 1 carries just 1/55. That linear decay puts its responsiveness between SMA and EMA: faster than a simple average, but without the aggressive front-loading that makes EMA whipsaw in choppy conditions. Traders reach for WMA when they want extra sensitivity on shorter timeframes without the EMA's tendency to overreact to a single outsized candle.
Smoothed / Wilder's Moving Average (SMMA/RMA)
SMMA — also called RMA, Wilder's smoothing — uses a 1/n multiplier instead of EMA's 2/(n+1), which makes it mathematically a much slower EMA. A 14-period RMA behaves closer to a 27-period EMA in terms of lag. This isn't a niche curiosity — it's the engine under RSI and ATR. That's exactly why RSI doesn't spike wildly on every single-bar move and why ATR-based stops don't get yanked around by one volatile candle. If you've ever wondered why RSI feels "sticky" compared to a raw price oscillator, the smoothed moving average RMA calculation is the reason.
Hull Moving Average (HMA)
HMA combines weighted moving averages at two different lengths and a square-root-scaled smoothing step to strip out lag aggressively — often visually hugging price within a bar or two of a turn, versus 8-15 bars for a comparable EMA. The trade-off: HMA overshoots. It hooks and re-hooks around minor pullbacks that a standard EMA would ignore, so it's built for traders who want early entries on momentum swings and are willing to accept more false hooks in exchange for less lag.
VWAP — the one that isn't really a moving average
VWAP (volume-weighted average price) isn't a rolling-window average at all — it's anchored to a session and resets at the open, weighting every price by the volume traded at that price rather than by time elapsed. That anchoring is why VWAP is a staple on US100 and CME futures, where centralized volume data is real and complete — institutional desks use it as a fair-value benchmark all session long. It's far less reliable on spot forex, where volume is fragmented across decentralized liquidity providers and no single feed reflects true market volume, so a forex VWAP is really just an approximation dressed up as one.
| Type | Responsiveness | Smoothness | Best use |
|---|---|---|---|
| WMA | Medium-high | Medium | Short-term trend entries, less noisy than EMA |
| SMMA/RMA | Low | Very high | RSI, ATR, and other indicator smoothing |
| HMA | Very high | Low | Early momentum signals, aggressive swing entries |
| VWAP | Session-dependent | Medium | Intraday fair value on US100 and futures, not spot forex |
Choosing Periods: Why 20, 50, 100 and 200 Persist
The 50 and 200 period settings work because so many traders and algorithms watch them — not because of any mathematical magic in the numbers themselves. That's the honest answer, and it matters for how you use them. An 8/21 EMA ribbon on a 5-minute chart carries none of that reflexive weight; it's a convention traders adopted because it looks clean, not because institutional order flow clusters around it.
SMA periods that carry institutional weight — 50 and 200
Among all sma periods traded, 50 and 200 sit in a different category. Pension funds, CTAs, and index-tracking algorithms use the 200 day moving average as a standing definition of "long-term trend intact or broken" — it's baked into risk models and rebalancing logic across the industry. The 50-day plays the same role on a medium-term horizon. Because so much capital references the same two numbers, price genuinely tends to react around them — support and resistance that becomes self-fulfilling simply through crowding. Try the same test with a 47-period or 63-period SMA and you won't find the same institutional footprint, even though the line itself looks almost identical.
Golden cross and death cross: what they actually signal
The golden cross death cross pair — 50 SMA crossing above the 200 for golden, below for death — gets treated as a buy/sell signal in retail content. It isn't one. Both are lagging regime confirmations, not entries. By the time the 50 has crossed the 200, price has typically already moved a significant distance from the swing that started the trend; you're confirming a regime that began weeks earlier, not catching it. Use the cross as a filter for trade direction and position sizing, not as a trigger — pair it with a faster signal (price structure, an RSI reset, an EMA pullback) for actual entries.
Intraday sets — 8/21 EMA ribbon and the 9/20/50 EMA day-trading stack
For the best moving average for day trading, the logic flips. The 8/21 EMA ribbon is popular for fast markets — gold, US100 futures, high-beta names — because the tight spread between the two lines gives an early read on momentum shifts without excessive whipsaw. The 9/20/50 EMA stack extends this into a full regime view: 9 for immediate momentum, 20 for the intraday trend, 50 as the session-level backstop. None of these numbers have institutional backing like 50/200 does on daily charts — they're arbitrary but useful conventions, refined by trial across thousands of intraday setups rather than by any structural significance.
Scaling period to ATR and timeframe instead of copying defaults
Rather than copying default periods across every instrument, pick the length so the MA sits outside normal noise — roughly where price spends most of its time on one side of the line rather than chopping through it. When volatility expands, widen the period or the band around it; a fixed 20-EMA that worked fine in a quiet range will get clipped repeatedly once ATR doubles. Cross-check any setting against a volatility-scaled distance rather than trusting the round number.
| Setting | Timeframe | Basis for the number |
|---|---|---|
| 50 / 200 SMA | Daily | Institutional reference levels — genuinely reflexive |
| 8/21 EMA ribbon | Intraday, fast markets | Convention, no reflexive backing |
| 9/20/50 EMA stack | Day trading | Layered momentum view, arbitrary but tested widely |
| ATR-scaled MA | Any | Adjusted to current volatility regime |
A Simple Moving Average Strategy With Actual Rules
Trend filter: price above a rising 50 SMA. Entry: pullback into the 20 EMA with a reclaim close. Stop: 1.5× ATR below the swing low. First target: 1R, remainder trailed behind the 20 EMA. Invalidation: a daily close below the 50 SMA. That's the whole simple moving average strategy in one sentence — everything below is just the detail that keeps you from blowing it up on execution.
Entry trigger: pullback to the MA, not the cross itself
Don't buy the cross. By the time a fast EMA crosses a slow SMA, the move that mattered already happened and you're buying into whoever's left holding momentum. Instead, wait for price to pull back into the 20 EMA acting as dynamic support and resistance, then require a full-body close back above it — not a wick, not an intrabar touch. That reclaim close is your permission to enter. On XAUUSD's 1H chart this filters out a huge chunk of the fakeout pullbacks that stop you out one bar before the real leg starts.
Stop placement using ATR, not the round number
Everyone parks their stop just under the 20 EMA or at the last round number — which is exactly why price sweeps it first. Use ATR stop placement instead: measure the 14-period ATR, multiply by 1.5, and place your stop that distance below the actual swing low, not below the moving average line. This puts your risk where the structure breaks, not where the crowd's orders are sitting.
Invalidation, partial exit and trail
- Invalidation: a daily close below the 50 SMA kills the long thesis outright — no debating it, no "let's see if it holds."
- First target: take partials at 1R. This isn't optional; it funds the trade psychologically and locks in something before news risk (FOMC, NFP) can erase it.
- Trail: run the remainder with a trailing stop behind the 20 EMA — when a daily close breaks the EMA, you're out, full stop.
This structure is inseparable from position sizing — see our risk management guide for how R-multiples translate into actual lot size against your daily loss limit.
Combining SMA and EMA without double-counting the signal
The hybrid version works because the 50 SMA and 20 EMA answer different questions instead of confirming the same one. The SMA is your regime gate — is this asset in an uptrend at all? The EMA is your trigger — is now the moment to act inside that regime? That's a division of labor, not confluence.
Where traders wreck this: stacking three or four MAs (9, 20, 50, 200) and calling every alignment "confluence." Three moving averages derived from the same price series are correlated by construction — you're not getting three opinions, you're getting one opinion counted three times. If you want genuine confirmation, cross-check momentum with MACD (12, 26, 9) — it's EMA-derived but measures a different thing entirely: the rate of change between two EMAs, not price position relative to one. A MACD histogram turning positive on your pullback entry is real corroboration. A fourth EMA lining up with the other three is noise dressed as signal.
Ready to trade funded capital?
Choose your path — Instant Accounts, One-Step or Two-Step Challenges — from just $23, with up to $300,000 in funded capital.
Choose your challengeWhy Moving Averages Fail: Chop, Whipsaw and Regime Filtering
A moving average is a trend-following tool built on a trending assumption — feed it choppy range conditions and it will sell the low and buy the high on repeat. That's not a bug you can code away with a better period setting. It's structural. Both the SMA and EMA are just different weighting schemes for the same premise: price is going somewhere. When price is going nowhere, the line becomes a whipsaw generator, and the faster the average, the more cuts you take.
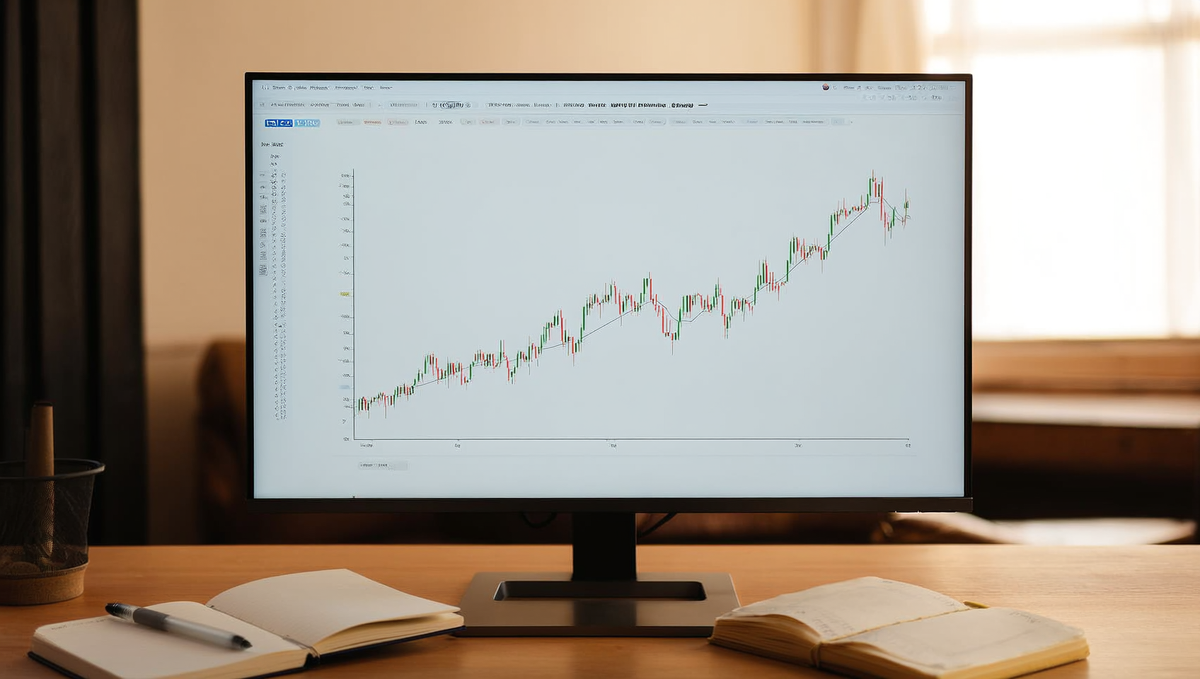
Three signs you're in a range before the losses tell you
- MA slope flattening in ATR terms. Measure the average's rise or fall over the last 5-10 bars and express it as a fraction of current ATR(14). When a 20-period EMA moves less than roughly 0.1× ATR per bar, you're in chop — the line has effectively gone sideways even if it's technically still sloped.
- Crossing frequency in a rolling window. Count how many times price has crossed your MA in the last 20-30 bars. More than 4-5 crosses in that window is your objective whipsaw flag — a trending market simply doesn't cross its own moving average that often.
- SMA and EMA converging and tangling. In a real trend the two lines separate, with EMA leading. In a range they collapse onto each other and cross back and forth — a visual tangle that's easier to spot than to code, but you can proxy it by tracking the absolute distance between your fast SMA and fast EMA as a percentage of price.
Layer in an ADX trend filter as confirmation: ADX below 20 on the 14-period setting is the industry's rough consensus for "no trend to speak of." Combine that with a flattening slope and elevated cross count and you've got three independent votes telling you the same thing — stand down.
Filters that genuinely reduce false crosses
None of these remove whipsaw. They reduce its frequency and cost you some trend entries in exchange — that trade-off is the whole game, not a flaw in the filter.
- Close-beyond-the-line requirement. Instead of acting on any touch or wick-cross, require a close beyond the MA by a fraction of ATR — say 0.25× ATR. This alone kills a large share of intrabar fakeouts.
- Separation requirement between fast and slow MA. Don't just wait for the cross — wait for the fast MA to pull a minimum distance ahead of the slow one before you treat it as a signal. This directly targets the "tangle" problem above.
- Session-time filters around FOMC and NFP. Moving average false signals cluster hard in the minutes around scheduled volatility events. Blacklisting trade entries in a 30-60 minute window around Federal Reserve announcements and Non-Farm Payrolls removes some of the ugliest, fastest whipsaws you'll ever eat.
What doesn't help: stacking more moving averages on top, or extending lookback periods until the line barely moves. Both just add moving average lag — you'll enter later, exit later, and still get chopped up, just on a longer timescale.
When the correct trade is to stand down
When your ADX reads sub-20, your MA slope is flat in ATR terms, and price has crossed the line five-plus times in the last session — that's not a setup to fix with a tighter filter. That's a range. The disciplined move is no trade, not a smaller position. Capital preserved in chop is capital available when the regime actually shifts.
Settings That Fit the Instruments You Actually Trade
The right MA period isn't universal — it's a function of the instrument's ATR behavior and session structure. Gold, indices, and futures each punish a generic "use a 20 EMA everywhere" approach in different ways, and since XAUUSD is the most-traded instrument on the For Traders platform, that's where getting the settings wrong costs the most.
XAUUSD: ATR expansion, news spikes and why gold punishes fast EMAs
Gold's ATR can double inside 15 minutes around CPI or an FOMC release. A tight EMA — say a 9 or 12 period on the 5-minute chart — reacts to that expansion by flipping direction repeatedly, and you end up trading the noise, not the move. Practical XAUUSD moving average settings favor either a wider period (21 EMA or 50 SMA on intraday charts) or an ATR-scaled buffer around the line — don't act on a cross until price clears the MA by at least 0.5× current ATR. That single filter cuts a huge share of the false signals that fast EMAs generate around news spikes. If you're building this out further, our XAUUSD trading strategy breakdown covers how we scale entries around these expansion windows.
US100 / Nasdaq futures: session structure and VWAP
On US100 NSDQ and Nasdaq futures moving average setups, volume is real (unlike spot forex or gold), so session VWAP plus a 20 EMA is a legitimate combo — the EMA gives you trend bias, VWAP gives you the intraday fair-value reference institutional flow actually respects. The overnight session tends to be thinner and choppier than the cash open, so a 20 EMA that works clean from 9:30-11:00 ET can whipsaw at 3 a.m. Adjust period or step aside outside the main session rather than forcing the same settings around the clock.
CME futures and crypto: 24-hour sessions, gaps and contango context
Futures on CME settle daily, and that settlement print can create a gap your SMA window doesn't "see" the same way a continuous EMA does — a few stale bars sitting in an SMA's average can flatten its response right when the market gaps through it. Crypto removes the gap problem (it never really closes) but adds noise — 24-hour crypto moving averages need longer periods than their equity-hours equivalents just to filter weekend chop. If you're rotating between contract months, remember basis and contango can distort what looks like "trend" on an unadjusted continuous chart. Our futures prop trading guide walks through contract-roll handling in more detail.
Decision table — instrument × timeframe × regime → MA type and period
| Instrument | Timeframe | Regime | MA Type | Period | Why |
|---|---|---|---|---|---|
| XAUUSD | 5m–15m | News/high ATR | EMA + ATR buffer | 21 | Filters expansion whipsaws |
| XAUUSD | 1H–4H | Trend | SMA | 50 | Holds through gold's pullbacks |
| US100/NSDQ | 5m–15m | Cash session | EMA + VWAP | 20 | Volume-confirmed reactivity |
| Nasdaq futures | Daily | Any | EMA | 50/200 | Handles roll gaps better than SMA |
| CME futures (broad) | 4H–Daily | Trend/Range | SMA | 50 | Smooths settlement-driven noise |
| Crypto | 1H–4H | 24hr continuous | EMA | 34/55 | Longer period offsets weekend noise |
Whether you build these on TradingView or MetaTrader, the MA settings translate directly — TradingView MetaTrader MA settings are functionally identical, so the table above holds regardless of platform.
Whipsaw Math vs Your Prop Drawdown Rules
A faster EMA doesn't just change your entries — it changes how many losing trades your daily loss limit can absorb before your trading day is over. Every whipsaw costs you roughly 1R, and if your daily loss limit is a fixed percentage of starting balance, the number of consecutive fakeouts you can survive is pure arithmetic, not a feel-good indicator debate.
How many false crosses a daily loss limit can absorb
Say your prop firm risk rules set a 5% daily loss limit and you risk 1% per trade. That's five losing trades — five whipsaws — before you're done for the day, assuming no partial wins to offset. Drop your risk to 0.5% and you've doubled your runway to ten fakeouts. A 9/21 EMA crossover on a choppy NSDQ session can throw four or five false signals in a single afternoon around a data print like NFP. If you're sized at 1% and using a fast EMA in a ranging market, you can burn through your entire daily loss limit before lunch — not because the EMA was "wrong," but because your position size didn't account for its higher signal frequency.
| Risk per trade | Daily loss limit (5%) | Consecutive whipsaws survived | Max drawdown (10%) survived |
|---|---|---|---|
| 2.0% | 5% | 2 | 5 |
| 1.0% | 5% | 5 | 10 |
| 0.5% | 5% | 10 | 20 |
| 0.25% | 5% | 20 | 40 |
Sizing so a losing sequence is survivable, not fatal
Position sizing is where indicator choice and prop firm risk rules actually meet. A 12/26 EMA crossover on gold generates noticeably more crosses per week than a 50-period SMA — that's the trade-off for catching trend changes early. If you're running the faster setup, the fix isn't abandoning the EMA; it's cutting risk per trade so a bad sequence of five or six fakeouts eats into your max drawdown allowance without breaching it. Think of your daily loss limit as your ammunition for the day and max drawdown as your ammunition for the evaluation — a fast-reacting MA burns through both quicker, so your size has to shrink to match.
Testing the configuration on simulated capital before it costs you an evaluation
Before you risk a real attempt, run a moving average backtest over at least 100–200 bars on your target instrument and count the whipsaw rate — how many crosses reversed within, say, five bars against you. That number tells you your realistic loss frequency. Then forward-test the exact configuration — MA settings, stop distance, position size — on a For Traders Challenge, where the daily loss limit and max drawdown rules force honesty about whether the setup is genuinely tradeable, not just theoretically profitable on a clean chart. Most evaluations don't fail because the trader picked SMA instead of EMA — they fail because position sizing never adjusted for how often that indicator gets faked out.
Ready to trade funded capital?
Choose your path — Instant Accounts, One-Step or Two-Step Challenges — from just $23, with up to $300,000 in funded capital.
Choose your challengeSMA vs EMA: Where Each One Actually Wins
Pros
- SMA — flat 1/n weighting produces a smoother line that filters single-bar spikes, which matters on gold around news releases
- SMA — the 50 and 200 settings are watched widely enough to act as genuine dynamic support and resistance
- SMA — fewer crossovers per 100 bars means fewer whipsaw losses eating into a daily loss limit
- EMA — the 2/(n+1) multiplier puts 18.18% of a 10-period value on the latest close, so turns register earlier
- EMA — shorter half-life (roughly 0.35 × n bars) makes it better suited to intraday pullback entries
- EMA — underpins MACD and most momentum tooling, so it integrates cleanly with existing indicator stacks
Cons / risks
- SMA — centre-of-mass lag near (n−1)/2 bars means late trend entries and late exits after a reversal
- SMA — a large bar rolling off the back of the window can turn the line on a day price barely moved
- SMA — gaps on lower timeframes distort the average more than traders realise
- EMA — more signals means more false signals; in a range it will cross repeatedly against you
- EMA — sensitivity to a single outlier close makes it fragile on news-driven spikes in XAUUSD
- EMA — never fully discards old data, so an extreme historical bar keeps a residual influence
Frequently Asked Questions
What is the difference between simple and exponential moving average?+
A simple moving average (SMA) weights every price in the lookback period equally, while an exponential moving average (EMA) weights recent prices more heavily using a multiplier of 2/(n+1). That weighting makes EMA react faster to new price action, so it hugs the current candle closer and turns sooner at reversals. SMA lags more but filters noise better, which is why it's favored for identifying the broader trend on higher timeframes. Neither is objectively better — the choice depends on whether you need speed (EMA) or stability (SMA) for your setup.
What exactly is a simple moving average and how is it calculated?+
A simple moving average is the arithmetic mean of a set number of closing prices over a chosen period, recalculated as each new candle closes. To get a 20-period SMA, you sum the last 20 closes and divide by 20 — that's it, no weighting involved. As price moves forward, the oldest data point drops off and the newest one gets added, so the line shifts with the dataset. Because every input carries equal weight, an old spike from 19 candles ago still influences the line just as much as yesterday's close, which is what gives SMA its characteristic lag.
How does the EMA smoothing multiplier 2/(n+1) work?+
The multiplier 2/(n+1) determines how much weight the most recent price gets versus the prior EMA value in the formula EMA = (Close × multiplier) + (Prior EMA × (1 − multiplier)). For a 20-period EMA, that's 2/21 ≈ 9.5%, meaning the newest close directly contributes about 9.5% to the current value while the rest carries forward the accumulated trend. Shorter periods produce a larger multiplier and a faster-reacting line — a 9-period EMA reacts noticeably quicker than a 50-period one. In practice, EMA responds to a breakout roughly 30-40% faster than an equivalent-period SMA, at the cost of more whipsaw in chop.
Is SMA or EMA better for day trading versus swing trading?+
EMA generally suits day trading better because its faster reaction helps you catch intraday momentum shifts and time entries closer to the actual turn. SMA tends to suit swing and position trading, where you want a smoother line that filters out intraday noise and confirms trend direction over days or weeks. Many traders blend both — a fast EMA (9 or 21) for entries and a slower SMA (50 or 200) for the macro trend filter. On a fast-moving instrument like XAUUSD, that EMA/SMA combo helps separate genuine momentum from a temporary spike around news like NFP or FOMC.
What other types of moving averages exist beyond SMA and EMA?+
Beyond SMA and EMA, common variants include the weighted moving average (WMA), smoothed moving average (SMMA, also called RMA), Hull moving average (HMA), and volume-weighted average price (VWAP). WMA assigns linearly decreasing weight to older prices, similar in spirit to EMA but calculated differently. SMMA/RMA smooths more aggressively over a longer effective lookback, useful for filtering choppy pairs. HMA aims to reduce lag while staying smooth, and VWAP anchors to volume rather than time, making it a session-based reference many futures and index traders watch intraday rather than a trend-following tool.
What SMA periods should you use — 20, 50, 100, or 200?+
The 20, 50, 100, and 200-period SMAs are default settings because so many traders and institutions watch them, which becomes self-reinforcing — price often reacts near these lines simply because everyone's algorithm and eye is on the same level. The 20 SMA tracks short-term momentum, the 50 is the standard medium-term trend gauge, and the 200 defines the long-term trend used in golden cross and death cross signals. On lower timeframes for day trading, traders often scale these down (e.g., 20/50 on a 5-minute chart), but the round numbers themselves matter less than consistency in how you use them.
What's a simple moving average strategy with clear entry and exit rules?+
A basic SMA strategy trades pullback entries in the direction of a 50 SMA trend filter: only take longs when price is above the 50 SMA on the higher timeframe, enter when price pulls back to touch or slightly pierce the 50 SMA and prints a bullish reversal candle, and place your stop just below the recent swing low or 1.5×ATR beneath entry. Exit at a fixed R:R target (2:1 minimum) or trail the stop below a faster SMA like the 20. The edge comes from discipline in only taking the setup when the trend filter agrees — skipping counter-trend signals is what separates this from random entries.
Why do moving averages fail in ranging markets?+
Moving averages lag price by design, so in a range they repeatedly cross back and forth as price oscillates around the mean, generating false signals known as whipsaws. A trend-following tool has no edge when there's no trend — the average just gets chopped through in both directions, stopping out breakout and pullback trades alike. To filter this, pair your MA with a trend-strength filter like ADX (only trade MA signals above ADX 20-25) or widen your stop and reduce position size when ATR shows compressed, range-bound volatility rather than expansion.
How reliable are golden cross and death cross signals?+
A golden cross (50 SMA crossing above the 200 SMA) or death cross (50 crossing below 200) signals a shift in long-term trend, but reliability is mixed — because both lines are lagging indicators, the cross often confirms a move that's already well underway, sometimes after 10-15% of the trend has already played out on indices. It works better as a macro trend filter than a precise entry trigger — many traders use the cross to set directional bias, then wait for a pullback entry rather than buying the exact crossover candle. On XAUUSD and major indices it has historically flagged real multi-month trends more often than not, but whipsaws do occur in choppy years.
How do you set stops around a moving average to avoid a daily loss limit breach?+
Place your stop based on volatility, not the moving average line itself — a common rule is 1.5× ATR beyond the MA, since the round MA value or a tight distance right at the line gets hit first during a whipsaw wick. Size your position so that single stop-out risks a fixed, small percentage of your account (commonly 0.5-1%), leaving enough room in your daily loss limit for two or three losing setups before you'd hit a challenge violation. Avoid stacking multiple correlated MA-based trades (e.g., gold and silver longs off the same 50 SMA signal) on the same day, since correlated losses compound against one daily limit.
Written by
Marcel Hambálek
Senior Trader, For Traders
Marcel trades Futures and Forex day-trading setups on funded accounts and writes about the executional details most traders skip — order types, slippage, session timing, platform quirks on MT5 and NinjaTrader. Pragmatic, mechanics-first, no fluff.
Follow on LinkedInReady to trade funded capital?
Choose your path — Instant Accounts, One-Step or Two-Step Challenges — from just $49, with up to $300,000 in funded capital.
Choose your challengeTrade up to $300,000
Choose challenge