Trading in Volatile Markets: Strategies and Risks
Ways traders manage margin risk in volatile markets: margin mechanics, ATR-based position sizing, gap playbooks and worked XAUUSD and US100 numbers for 2026.

By Marcel Hambálek · Senior Trader, For Traders
Traders manage margin risk in volatile markets by cutting notional exposure before volatility expands, holding a free-margin buffer well above maintenance requirements, capping correlated positions, scaling position size to ATR rather than a fixed lot, using hard stops instead of mental ones, and reducing leverage ahead of scheduled events like FOMC, CPI and NFP.
Key takeaways
- Margin is not static — when realised volatility rises, margin requirements can be raised mid-session, shrinking your usable buying power while your open position is still running.
- Volatility-scaled sizing (risk ÷ ATR-based stop distance) automatically halves your size when ranges double, which fixed lot sizing never does.
- Gold and US indices expand far more violently than FX majors, so one sizing rule across all instruments is how most accounts get margin-squeezed.
- Overnight and weekend gaps price through stops — the only real defence is smaller exposure held over the break, not a tighter stop.
- Prop firm daily loss limits and max drawdown compress fast on a high-ATR day: a single wide-range candle can end an evaluation that was otherwise on track.
- Wider stops are correct in high volatility — but only when paired with proportionally smaller size, so dollar risk stays flat.
Watch: related video
Six Ways Traders Manage Margin Risk When Volatility Spikes
The short answer
Traders manage margin call risk in high volatility by doing six things at once: cutting notional exposure before the range expands, pre-funding a free-margin buffer well clear of the maintenance floor, capping correlated exposure (gold, silver and USD pairs move together more than you think), placing hard stops instead of mental ones, cutting leverage ahead of scheduled events like FOMC and NFP, and pre-planning exit levels before the position — not during it.
Initial margin, maintenance margin and free margin defined
Initial margin is the deposit your broker or prop firm's simulated platform requires to open the position in the first place. Maintenance margin is the equity floor that must stay funded to keep that position open — breach it and you're staring at a margin call. Notional exposure is simply contract size × price × lots — the real dollar value you're controlling, not the cash you put down. Free margin is what's left in the account after initial margin is locked up; it's your shock absorber. A margin call is the warning that equity has dropped toward maintenance level; forced liquidation is what happens when nobody responds in time and the platform closes the position for you, at whatever price is available — usually the worst one on the screen.
Why margin requirements get raised mid-regime
Margin isn't fixed — it's priced to risk. CME SPAN margin methodology recalculates required margin based on recent realised volatility, and during regime shifts (a surprise CPI print, a gold breakout through $2,500, a geopolitical shock) that requirement can jump with days or even hours of notice — see CME Group for how SPAN scales with volatility. CFD and prop-firm platforms mirror this logic: when ATR widens, the broker's own risk desk widens margin requirements to protect against gap risk. This is exactly why leverage risk in volatile markets isn't static — the same position that was comfortably margined on Monday can be under-margined by Thursday without you touching a single trade.
The liquidation maths: how close is your account really?
Numbers make this concrete faster than theory does.
| Scenario | Account equity | Effective leverage | Notional exposure | Adverse move to margin call |
|---|---|---|---|---|
| Over-leveraged | $50,000 | 100:1 | $5,000,000 | ~1.0% move in gold |
| Conservative | $50,000 | 20:1 | $1,000,000 | ~5.0% move in gold |
At 100:1, a single ordinary gold session — the kind that happens around an FOMC surprise — can wipe out the buffer and trigger forced liquidation before you've even opened your charts. At 20:1, the same account needs a five-times-larger adverse move to reach the same point. That gap is the entire argument for scaling notional to volatility rather than to how much margin the platform happens to allow you to use.
Reading the Volatility Regime Before You Size Anything
Before you touch a position-size calculator, work out what regime you're actually in — because the same lot size is conservative in a quiet tape and reckless in a stressed one. The tell isn't a feeling, it's three checkable numbers: the CBOE Volatility Index and its term structure, the instrument's own Average True Range relative to its recent average, and where Bollinger Bands sit relative to price. Read those first, then size.
The VIX and the VIX/VIX3M ratio
The CBOE Volatility Index (VIX) prices the market's expectation of S&P 500 volatility over the next 30 days, derived from options premiums. It's a proxy for the whole risk complex — when VIX climbs, correlations across gold, indices, and forex majors tend to rise with it, which matters when you're capping correlated exposure. But the level alone undersells the story. The VIX/VIX3M ratio — spot VIX divided by the 3-month VIX — tells you about term structure. In calm markets that ratio sits below 1: near-term fear is cheaper than fear three months out, a normal contango. When the ratio pushes above 1, you're looking at backwardation — the market is pricing more stress right now than it expects to persist. That flip has historically shown up alongside sharp equity drawdowns and, by extension, spillover volatility into US100 and gold. A VIX trading strategy built purely on absolute level misses this; the ratio is what flags a regime change is underway, not just elevated noise.
Average True Range as your instrument-level volatility read
VIX tells you about equity-index sentiment; it doesn't tell you what XAUUSD or EUR/USD is actually doing tick to tick. That's where Average True Range comes in. Pull the 14-period ATR on your instrument and compare it to its own 3-month average. Divide current ATR by that average and you get an expansion multiple — 1.0 is normal, 1.8–2.0 means the instrument is moving nearly double its typical range, which is exactly the condition that blows through stops sized for calm conditions. This is instrument-specific by design: gold can be running a 2.5x ATR expansion around an FOMC print while EUR/USD sits at 1.1x. Size each position off its own multiple, not a blanket assumption borrowed from the index.
Bollinger Bands and the squeeze
Bollinger Bands — a 20-period simple moving average with bands plotted ±2 standard deviations — measure the same thing ATR does, expressed as price dispersion rather than range. A squeeze, where the bands compress tightly around price, flags a period of unusually low volatility that historically precedes expansion, not the direction of it. John Bollinger himself was explicit that a tag of the upper or lower band is not, on its own, a buy or sell signal — it's a statement about extension relative to recent volatility, nothing more. Use the squeeze as a warning to reduce size ahead of a probable break, not as an entry trigger.
Put together, these three reads — VIX/VIX3M ratio, ATR expansion multiple, and band width — give you one practical output: a volatility expansion multiple. That number is what you carry into the position-sizing formula next, replacing guesswork with an actual measure of how much room the market currently needs.
Volatility-Scaled Position Sizing: The Formula and the Numbers
The fix for trading in volatile markets isn't a different risk percentage — it's a position size that shrinks automatically as the stop widens. The 1% rule keeps your dollar risk fixed at $500 on a $50,000 account. ATR position sizing is the mechanism that keeps that $500 real when the stop has to move from $18 to $42.
Step-by-step: ATR-based position sizing in five steps
- Define account risk in currency. 1% of $50,000 = $500. This number does not move.
- Measure current ATR. Pull the 14-period ATR on your working timeframe — daily for swing entries, H1 for intraday.
- Set stop distance as an ATR multiple. 1.5–2× ATR is the standard band; tighter and normal noise stops you out, wider and you're paying for room you don't need.
- Convert stop distance to per-unit risk. Multiply the stop distance by the instrument's point/pip value or contract multiplier.
- Divide. Account risk ÷ per-unit risk = position size (lots or contracts).
Worked example — XAUUSD on a $50,000 account
On a quiet day, XAUUSD's daily ATR sits around $12. Using a 1.5× multiple, your stop distance is $18. On a standard lot (100 oz), that's $1,800 of risk per lot — so $500 ÷ $1,800 gives you a position of roughly 0.28 lots.
Now CPI prints hot and ATR expands to $28. Same 1.5× multiple puts your stop at $42, which is $4,200 of risk per lot. $500 ÷ $4,200 lands you at roughly 0.12 lots — about the same ratio the ATR expanded by (2.33×). The stop got wider, the size got smaller, the $500 risk never moved.
Worked example — US100 when ATR doubles
Take US100 with a normal ATR of 150 points and a point value of $20 per standard lot. A 1.5× stop is 225 points, or $4,500 per lot — sizing out to roughly 0.11 lots for $500 of risk.
Let ATR double to 300 points (a realistic post-FOMC or post-NFP expansion on the index). The stop widens to 450 points, or $9,000 per lot. Position size falls to roughly 0.05 lots — half the size, because the ATR doubled and the formula does the halving for you.
| Instrument | ATR | Stop (1.5×ATR) | Risk per lot | Position size ($500 risk) |
|---|---|---|---|---|
| XAUUSD (normal) | $12 | $18 | $1,800 | 0.28 lot |
| XAUUSD (post-CPI) | $28 | $42 | $4,200 | 0.12 lot |
| US100 (normal) | 150 pts | 225 pts | $4,500 | 0.11 lot |
| US100 (ATR doubled) | 300 pts | 450 pts | $9,000 | 0.05 lot |
Why the flat 1% rule still governs the dollar risk
Nothing above changes what you're willing to lose — it changes how many units you're willing to hold to keep that loss constant. That's the whole point of position sizing for volatility: the stop distance is allowed to move with the market, but the dollar figure at risk and the margin footprint both stay anchored to the same 1% every single time. Traders who blow accounts in volatile stretches usually didn't break the 1% rule on paper — they kept yesterday's lot size on today's ATR.
Instrument Volatility Profiles: Gold, Indices, FX and Futures
Not every instrument expands the same way when volatility hits, and that's exactly why a single lot-sizing rule across your whole watchlist gets traders into trouble. XAUUSD can double its daily range on a CPI print; EURUSD almost never does that in percentage terms. Treat them the same and you're either overexposed on gold or leaving performance on the table on FX.
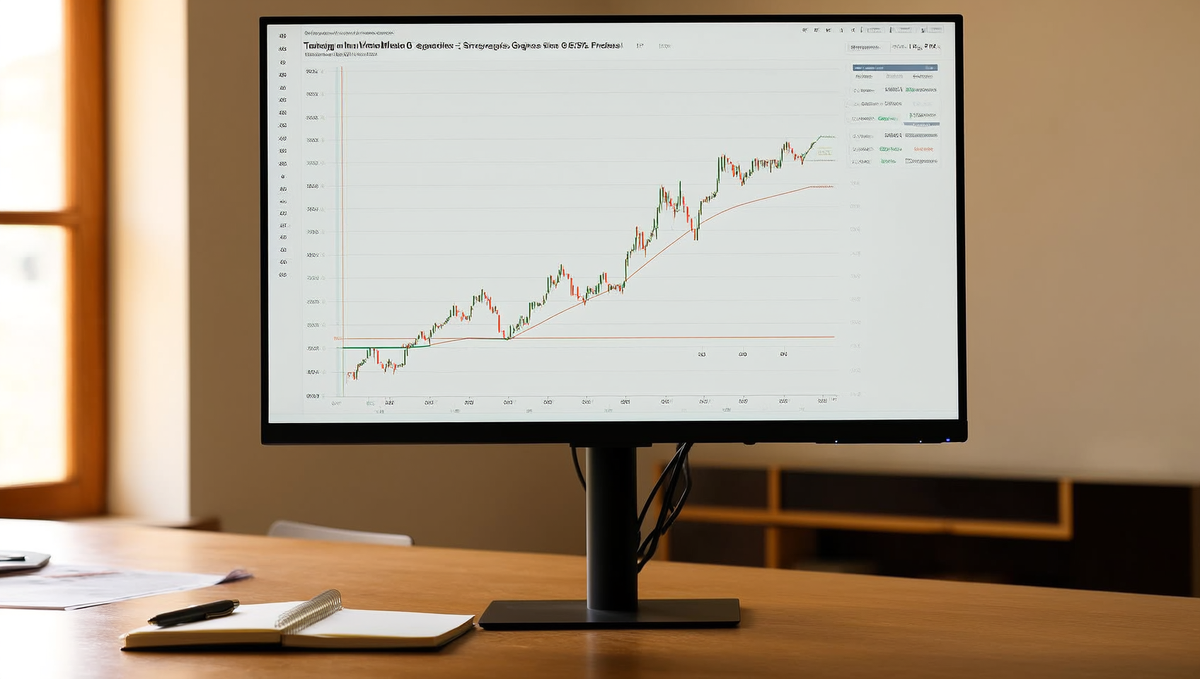
XAUUSD — the biggest range expander on most retail books
Gold is the single most-traded instrument on the For Traders platform, and that's precisely why its volatility behaviour deserves its own paragraph rather than a footnote. XAUUSD volatility isn't linear — a normal session might run $15-20, but a hot CPI number, an unexpected Fed comment, or a geopolitical headline can push that to $35-45 inside minutes. That's not a tail event; it's a Tuesday during data season. A position sized for the calm range gets margin-called or stopped out at a far worse price than planned the moment the range doubles.
US100 and NSDQ index CFDs
US100 CFD volatility tracks the Nasdaq's tech concentration — a handful of mega-cap earnings or a hawkish FOMC surprise moves the index harder, percentage-wise, than broad gold moves on an average day, and gap risk around the cash open is real in a way it simply isn't for 24-hour FX pairs. Overnight gaps on index CFDs are the reason stops placed without buffer room get filled well past the intended level.
FX majors and why EURUSD flatters your sizing model
EURUSD ATR sits comfortably low in normal regimes, which is exactly the trap: a lot size that's prudent on EURUSD looks reckless the moment you copy it onto XAUUSD or a futures contract without recalculating. EURUSD's low baseline volatility flatters traders into thinking their sizing model is conservative, when really it's only been tested against the calmest instrument on the sheet.
CME futures: fixed contract size, variable margin
Futures work differently at the mechanical level. Contract size is fixed — one ES point is always $50 — so your only volatility lever is contract count, not fractional lot adjustment. What moves constantly is the margin requirement itself: ES futures margin (and CME futures margin generally) is set under SPAN methodology, which recalculates as realized volatility shifts, sometimes overnight. A margin figure that held Monday can jump by 20-30% before Wednesday's open if the exchange judges the regime has changed — see CME Group for current SPAN parameters.
| Instrument | Normal daily range | Stressed daily range | Margin sensitivity | Gap behaviour | Suggested size cut in high vol |
|---|---|---|---|---|---|
| XAUUSD | $15-20 | $35-45+ | High — moves fast with realized vol | Moderate, headline-driven | 40-50% |
| US100 CFD | 150-200 pts | 350-450 pts | Moderate-high | Significant at cash open | 30-40% |
| EURUSD | 50-70 pips | 100-130 pips | Lower, but widens near NFP/FOMC | Low, 24hr market | 20-30% |
| ES futures | 30-45 pts | 70-100+ pts | SPAN margin can jump 20-30% overnight | Overnight session gaps | Reduce contract count 30-40% |
The Overnight and Weekend Gap Playbook
Slippage is the difference between the price you wanted and the price you got, and a stop-loss order is an instruction to exit at the next available price, not a guarantee of the price printed on your chart. Markets close, liquidity thins, and news happens while you sleep — and when price reopens, it can print straight through a resting stop with nothing to fill at along the way. That gap-through-stop scenario is the single most expensive lesson in trading volatile markets, and almost every trader learns it live, not in a demo.
Why a stop is not a guarantee: gap-through fills and slippage
Your stop order sits on the book as a resting instruction. When the market is open and liquid, it fills close to your level. When the market gaps — Sunday open on XAUUSD, a CME futures reopen after a weekend news shock — there's no continuous price action between Friday's close and the new print. Your order doesn't fill at your stop; it fills at the first available price after the gap, which can be 50, 100, even 300+ pips away on gold during a genuine risk-off weekend. That's overnight gap risk and weekend gap risk in one sentence: the exit you planned for doesn't exist, only the exit the market gives you.
Exposure reduction rules for the close
- Cut notional size before the session close if the position is still open into an illiquid window — don't wait for the last five minutes.
- Halve size heading into the weekend on anything correlated to gold, indices, or event-sensitive forex majors.
- Go flat entirely if the trade's thesis depends on a level holding rather than a macro view playing out — levels break on gaps, theses survive them.
Flat-by-Friday logic and the crypto exception
"Flat by Friday" isn't dogma, it's risk math: if you can't manage the position while the market is closed, you shouldn't be carrying full size into that closure. The exception is crypto, which trades 24/7 — no weekend gap exists because there's no weekend close. That's one reason futures prop trading desks increasingly separate crypto-linked risk rules from equity-index and metals rules on the same book.
Protective puts, collars and futures roll timing
Traders with options access use protective put options as defined-risk downside insurance — you know your maximum loss on the hedge before the weekend even starts, unlike a stop that can be gapped through. A collar (selling a call to finance the put) reduces the cost of that insurance at the expense of capped upside. On futures, roll positions away from expiry and away from low-liquidity windows — holding into expiry week concentrates gap risk exactly when volume thins and spreads widen.
None of this is theoretical for CFD gold and index positions: there's no market to exit into over the weekend, and swap and financing costs quietly punish oversized positions carried for no reason. Reducing exposure before the close isn't caution for its own sake — it's one of the more basic trading tips for volatile markets that separates traders still standing after a gap weekend from the ones nursing a stop that never got hit.
Ready to trade funded capital?
Choose your path — Instant Accounts, One-Step or Two-Step Challenges — from just $23, with up to $300,000 in funded capital.
Choose your challengeScheduled Events vs Unscheduled Shocks
The control you use depends entirely on whether you saw the volatility coming. Scheduled releases give you a clock to trade around — the risk control is pre-event sizing. Unscheduled shocks give you nothing, which means the control has to already be sitting in your account before the news hits.
FOMC, CPI and NFP: pre-event size, spread widening and the first two minutes
FOMC volatility trading, CPI print volatility, and NFP trading all share the same mechanical problem: liquidity providers pull quotes or widen them hard in the seconds before and after the release. Spread widening on news isn't a broker quirk — it's every counterparty repricing risk at once, and on XAUUSD or NSDQ futures that widening can run several times the normal spread for the first 30-90 seconds. A stop placed a few pips from entry doesn't protect you in that window; it just guarantees you get filled at whatever price is available, which during a hot CPI print might be nowhere near where you thought your risk was capped.
The pre-event control is simple and unglamorous: cut size or go flat before the print. If you're carrying a position into FOMC at your normal lot size, you're not trading the news — you're gambling on a coin flip with your risk parameters disabled for two minutes.
Trading the second move, not the first
The initial spike on a release is noise dressed up as signal. Price often overshoots on the first tick as stops get run and algos react to the headline number before the market has actually digested it — the real positioning shows up in the second leg, once spreads normalize and the initial move gets faded or confirmed. Disciplined traders wait for that second move deliberately: they let the first 60-120 seconds play out, watch whether price holds the breakout or snaps back, and only then size in with a stop that means something. Chasing the first candle on NFP is how you end up buying the exact top of the spike.
When the shock is unscheduled
An unscheduled shock — a surprise rate cut, a geopolitical headline, a flash crash in correlated futures — gives you no lead time, so pre-event sizing doesn't exist as an option. The only thing that saves you is structure already in place before the shock: exposure caps that limit how much of your account any single instrument can represent, correlated-position limits so a gold and dollar-index trade don't quietly double your directional bet, and a free-margin buffer wide enough to absorb a move you never saw building. Worth noting too — some brokers and exchanges raise margin requirements ahead of known high-impact events, which is itself a signal the market is bracing for size. If your buffer only covers routine volatility, an unscheduled shock finds the gap immediately.
Strategies That Work in Volatile Markets — and Where Each Fails
Every volatile market trading strategy that works also has a specific regime where it stops working — and the traders who blow up accounts are usually running the right strategy in the wrong regime, not the wrong strategy entirely. Here's the honest version of four core approaches, failure conditions included.
Breakout trading
Breakout trading earns its keep when a range has been coiling — a squeeze, tightening Bollinger Bands, ATR compressing — and volatility expands directionally once price clears the level. XAUUSD post-consolidation breaks or a US100 gap-and-go after a squeeze are the textbook setups. The failure mode is whipsaw: choppy, headline-driven regimes where every break reverses within a few bars because there's no real supply/demand imbalance behind the move, just noise. In that environment breakout traders get stopped out repeatedly on false starts — the setup looks identical each time, but the follow-through never arrives.
Scalping
A scalping strategy needs two things simultaneously: high volatility (so small moves are worth taking) and tight spreads (so the edge isn't eaten alive by cost). The problem is these two conditions often break apart at the exact moment volatility spikes — during NFP or an FOMC surprise, spreads on forex majors and gold can widen 3-5x in seconds as liquidity providers pull quotes. That's precisely the environment that looks most attractive to a scalper and is often the least tradeable one. Slippage on entries and exits stacks up fast when you're taking 10-20 pip targets against a spread that just doubled.
Hedging with protective puts
Buying a protective put defines your downside at a known premium — you know your worst case before the trade, which is the whole appeal. The failure condition is pricing: implied volatility rises with realised volatility, so the exact moment you want protection most is when that premium is most expensive. Buying puts after VIX has already spiked is buying insurance after the storm's started — you pay a volatility premium for protection you needed cheaply a week earlier.
Gamma scalping and delta-neutral hedging
Delta-neutral hedging — rebalancing your delta exposure as the underlying moves, the approach Charles Schwab's options education frames as continuously trading against your own option position — lets you harvest realised volatility without taking a directional view. It works when you can rebalance cheaply and frequently. It fails when option liquidity is thin, bid-ask spreads on the options themselves are wide, or transaction costs eat the theta you're trying to capture. This is a strategy for liquid underlyings — major indices, gold, large-cap forex pairs — not for illiquid futures contracts where every rebalance leg costs you real edge.
| Strategy | Works when | Fails when |
|---|---|---|
| Breakout trading | Range expanding from a squeeze | Whipsaw regime, every break reverses |
| Scalping | High volatility + tight spreads | Spread widening eats the edge |
| Protective puts | Bought before IV spikes | Premium priciest exactly when needed |
| Gamma scalping / delta-neutral | Liquid options, low transaction cost | Thin liquidity, wide spreads erode theta |
One margin note that applies across all four: a hedged position is not a margin-free position. Holding a long gold position against a protective put, or running a delta-neutral book against futures, still ties up margin on every leg — your broker or prop firm nets exposure for risk purposes, not for margin purposes, in most cases. Build your free-margin buffer assuming the hedge counts against you, not for you.
Is This Volatility Tradeable? A Three-Filter Check
Not every volatile session deserves a position. Run three filters before you size up: is the range actually expanding, is the spread still payable relative to your target, and does your stop have a real structural level to sit behind. Fail any one and the honest answer is no trade — not a smaller trade, no trade.
Filter 1: is range expanding or just noisy?
High ATR alone tells you nothing about direction — it tells you price is moving, not that it's going anywhere. True range expansion shows higher highs in ATR alongside closes that hold beyond the prior structure — a breakout on XAUUSD that closes through $2,650 and stays there, not one that tags it on a wick and snaps back. Unfarmable chop looks exciting on the same chart — huge ATR, wide bars — but price keeps returning to the same mid-range pivot every time, session after session. That's a market handing liquidity to whoever's on the other side of your stop. If you can't tell the two apart in the first ten minutes of looking, that's your answer: sit out until closes confirm one side.
Filter 2: is the spread still payable?
Volatility widens spreads before it widens your opportunity — that's the part most retail traders skip. Compare the current spread to your average target in pips or ticks. If your typical XAUUSD scalp targets 80 pips and the spread has widened from 20 cents to $1.20 around an FOMC print, you're giving back over a full percent of your target before the trade even breathes. Do the same math on NSDQ futures around the CME open — a wider bid-ask during the first two minutes can eat a third of a scalper's edge. If spread cost exceeds roughly 10-15% of expected move, the edge is gone regardless of how good the setup looks on the chart. This is a volatility risk theme retail traders underweight constantly — they see the move, not the cost of entering it.
Filter 3: does your stop have somewhere logical to sit?
If there's no structural level — prior swing high, session low, a clean round-number cluster — within a defensible ATR multiple of current price, you're not placing risk, you're guessing. A stop that sits at "2x ATR because that's the rule" with no structure behind it gets run on the first liquidity sweep. A stop tucked behind the actual level that broke, protected by real order flow, has a reason to hold. No level, no trade.
Some days all three filters fail — expansion looks fake, spread's still fat an hour after the news, and there's no clean level anywhere near price. The correct move on those days is flat. Not a demo-account ego problem, not a missed opportunity — just the one variable in a volatile market strategy you fully control: whether you're in the market at all.
How Prop Firm Rules Behave on a High-ATR Day
On a $50,000 simulated account with a 5% daily loss limit ($2,500), a single wide-range gold candle taken at your normal size can burn the entire day's allowance in one fill. That's the arithmetic evaluation traders skip until it happens to them — and it's the reason a rule that feels restrictive on a quiet Tuesday becomes the whole game on a CPI Wednesday.
Daily loss limit maths when the range doubles
XAUUSD's average true range on a normal session might run $12–15. On a high-ATR day — NFP, a surprise CPI print, an FOMC statement — that range can double to $28–35 without warning. If your stop distance and lot size were calibrated for the $12 day, your dollar risk per trade roughly doubles too, except now you're paying it in one candle instead of across the session.
| Position size (XAUUSD) | Stop distance | Risk per stop-out | % of $2,500 daily limit | Stop-outs to breach |
|---|---|---|---|---|
| 0.5 lot | $8 (normal ATR) | $400 | 16% | 6+ |
| 0.5 lot | $16 (high-ATR day) | $800 | 32% | 3–4 |
| 2.0 lots | $8 (normal ATR) | $1,600 | 64% | 1–2 |
| 2.0 lots | $16 (high-ATR day) | $3,200 | 128% — one trade breaches | 1 |
Same setup, same conviction, wildly different outcome — because size didn't move when ATR did.
Max drawdown and trailing drawdown mechanics
Static max drawdown rules set a fixed floor from your starting balance — lose 10% of $50,000 and you're out, full stop. Trailing drawdown is a different animal: the floor follows your equity high, ratcheting up every time you bank a new peak. This is where prop firm evaluation risk catches traders who never blew a static limit — give back part of a winning day under a trailing rule and you're not just losing that day's gains, you're compressing the buffer you have left to trade with, sometimes down to nothing. It's why a green Monday followed by a red Tuesday can end an evaluation that a flat Monday-Tuesday never would have touched.
Sizing backwards from the rule, not forwards from conviction
Stop sizing from "how sure I am" and start sizing from "how many stop-outs my daily loss limit needs to absorb." Decide the number first — five consecutive losers is a reasonable, survivable target for most strategies — then divide: $2,500 ÷ 5 = $500 risk budget per trade. From there, your stop distance (set to current ATR, not yesterday's) tells you the position size, not the other way around.
These limits aren't an obstacle bolted onto your trading — they're the same discipline this whole guide is arguing for, just enforced automatically on simulated capital instead of left to willpower.
Ready to trade funded capital?
Choose your path — Instant Accounts, One-Step or Two-Step Challenges — from just $23, with up to $300,000 in funded capital.
Choose your challengeFrequently Asked Questions
What are the ways traders manage margin risk in volatile markets?+
Cutting position size as ATR expands is the core method — most traders scale size inversely to volatility so dollar risk per trade stays flat even when ranges widen. Alongside that, disciplined traders widen stops proportionally instead of leaving them fixed, cap total exposure across correlated pairs (gold, USD majors, indices often move together), and keep extra margin buffer above broker minimums so a single adverse leg doesn't trigger a margin call. Reducing leverage and trimming the number of concurrent open positions during high-ATR sessions rounds out the approach — fewer, smaller, better-placed trades beat a full book when spreads and slippage widen.
Why do margin requirements increase during volatile sessions?+
Brokers and exchanges raise margin requirements when realized volatility spikes because the risk of a large adverse move — and their own exposure to it — rises with it. This can happen within minutes around events like FOMC or NFP, or overnight when CME raises margins on futures like gold or ES ahead of anticipated moves. Historically, margin hikes of 20-50% aren't rare during high-VIX regimes. The practical effect: a position sized comfortably at 10am can suddenly require far more free margin by the close, which is why buffer above the minimum matters more than the minimum itself.
How do you size positions when ATR doubles?+
Volatility-scaled sizing means cutting your position size roughly in half when ATR doubles, so your dollar risk per trade (stop distance × size) stays constant. Practically: if you normally risk 1% with a stop at 1.5×ATR, and ATR jumps from 20 to 40 pips on gold, you either widen the stop to 60 pips and halve your lot size, or keep the stop tighter and accept a lower reward target. The formula traders use is position size = (account risk %) ÷ (stop distance in ATR-adjusted pips × pip value) — recalculated every session, not set once and forgotten.
Which risk tools matter most when markets move fast?+
ATR for stop placement and position sizing sits at the center, paired with hard stops that execute automatically rather than mental stops you might hesitate to pull. The VIX and the VIX/VIX3M ratio (a term-structure read on whether fear is building or fading) help traders judge regime before entering. Bollinger Band squeeze-and-expansion flags when a quiet range is about to break, and exposure caps across correlated instruments prevent one shock — a gold gap, a dollar spike — from hitting multiple open positions at once. None of these replace judgment; they just make discipline mechanical instead of emotional.
What can traders do about weekend gaps or overnight moves?+
Reducing size or closing positions before known gap risk — Friday close on geopolitical headlines, low-liquidity Sunday opens — is the main defense since stops can't fill at your price during a gap. Traders who hold through weekends typically use smaller size, wider mental buffers on stops, and check calendar risk (central bank decisions, elections, OPEC meetings) before Friday's close. On prop challenges specifically, check the platform's weekend-holding rules — some restrict or flag positions held over low-liquidity windows since gap fills count against daily loss limits the same as any other loss.
Which strategies actually work in volatile markets?+
Breakout strategies tend to work best in expanding-range regimes but fail badly in chop, where every breakout gets faded. Scalping can work in high-liquidity volatility (gold or NSDQ around news) but dies in gappy, thin conditions where fills slip badly. Hedging correlated exposure protects capital but caps upside, and gamma scalping (common in options, less so in retail futures) profits from realized volatility exceeding implied — it fails when volatility collapses post-event. The honest answer: match the strategy to the regime, don't force one approach across every volatile session.
How wide should stops be in high volatility without adding risk?+
Stops should widen in proportion to ATR — typically 1.5x to 2.5x the current ATR reading rather than a fixed pip count — while position size shrinks to keep total dollar risk unchanged. The mistake is widening the stop and keeping the same lot size, which quietly doubles your risk per trade. The fix: recalculate size every time you recalculate the stop, using the same account-risk percentage (commonly 0.5-1%) as your anchor, so a wider stop in gold or US100 costs you the same dollars as a tighter stop did last week.
How do prop firm daily loss limits interact with a high-ATR day?+
Daily loss limits and max drawdown rules get hit faster on high-ATR days because normal stop distances translate into bigger dollar swings, so traders on a Challenge need to cut size before volatility spikes, not after a loss trips the limit. A trader holding their usual size through an NFP print or a gold ATR expansion can burn through a daily loss limit on a single trade that would have been a routine stop-out on a calmer day. The disciplined approach on any Two-Step Challenge or Instant Funding account is treating high-ATR sessions as a size-reduction trigger, checked against the daily loss limit before entry, not during a drawdown.
How do you tell high-opportunity volatility from unfarmable chop?+
Directional volatility with expanding range and rising volume — visible as a Bollinger squeeze breaking cleanly with follow-through — is farmable; volatility with no directional persistence, wicks in both directions, and reverting price is chop. A quick check: does price make a new high or low and hold it for more than a few candles, or does it snap back immediately? The VIX/VIX3M ratio and ATR trend (rising vs. flat) help separate the two at a macro level, but on the chart, failed breakouts stacking up in both directions is the clearest chop signal traders use to stand aside.
Should you trade FOMC and NFP differently than unscheduled shocks?+
Scheduled events like FOMC, CPI, and NFP allow pre-positioning with reduced size or standing aside entirely until the initial spike settles, since the timing is known even if the direction isn't. Unscheduled shocks — a surprise headline, a flash crash, a geopolitical event — offer no such warning, so the defense is structural: exposure caps, hard stops always live, and enough margin buffer that a sudden gap doesn't trigger forced liquidation. Traders who separate these two categories in their playbook fare better than those treating every volatile move as the same kind of risk.
Written by
Marcel Hambálek
Senior Trader, For Traders
Marcel trades Futures and Forex day-trading setups on funded accounts and writes about the executional details most traders skip — order types, slippage, session timing, platform quirks on MT5 and NinjaTrader. Pragmatic, mechanics-first, no fluff.
Follow on LinkedInReady to trade funded capital?
Choose your path — Instant Accounts, One-Step or Two-Step Challenges — from just $49, with up to $300,000 in funded capital.
Choose your challengeTrade up to $300,000
Choose challenge