Seasonal Trading Patterns: Fact or Fiction?
Seasonal trading patterns graded fact, fading or fiction for 2026 — gold's January leg, Santa Claus Rally, sell in May, natural gas heating season and more.

By Marcel Hambálek · Senior Trader, For Traders
Seasonal trading patterns are real but uneven: a 217-year study across 68 markets by Erasmus University Rotterdam found persistent calendar effects, yet roughly half the famous retail patterns have decayed since 2000. Gold's January strength and the turn-of-the-month effect still hold; the January Effect in small caps is largely dead.
Key takeaways
- Seasonality is a recurring calendar-linked tendency in returns, volume or volatility — a probability tilt, never a signal on its own.
- The turn-of-the-month effect, gold's January and August legs and the natural gas heating-season cycle still show up in 2026 data; the January small-cap effect and a naive 'sell in May' exit largely do not.
- Futures seasonality is the least-crowded corner, but contract rolls and contango can invent or invert an apparent seasonal edge on continuous charts.
- A 12-year backtest is 12 data points — demand 25+ observations, a Sharpe above roughly 0.6 and a max drawdown you could actually survive under a daily loss limit.
- Holiday windows cut liquidity hard: US volume can fall toward 70% of normal by Thanksgiving Wednesday, widening spreads and worsening fills.
- Trade seasonal windows with technical confirmation, 1.5× ATR stops and fractional sizing so one failed pattern can't breach a max drawdown.
Watch: related video
Are Seasonal Trading Patterns Real? The Short Verdict
Yes, seasonal trading patterns are real — but only some of them, and never as a guarantee. Seasonality is a repeating tendency for a market to behave a certain way during a specific calendar window, driven by structural flows rather than chance. That's the whole definition. No mysticism, no lunar cycles — just recurring supply, demand, and capital-flow events that happen to line up with the calendar.
What seasonality actually means
A seasonal trader isn't betting on a date. They're betting on the recurring event behind the date — a harvest, a fiscal year-end, a heating season. The seasonality definition that matters for your P&L is narrow: a statistically observable tendency, not a rule. Gold tends to firm into January on Asian jewelry demand and portfolio rebalancing; that's a tendency built from decades of repeated flow, not a superstition.
Why some patterns persist and others die
Researchers at Erasmus University Rotterdam ran the toughest test anyone's applied to this idea — 68 markets, 217 years of data — and still found calendar anomalies that survived out-of-sample. That's the strongest evidence we have that seasonal trading isn't purely a data-mined artefact dressed up in a spreadsheet.
But persistence isn't universal, and the line is instructive:
- Structural causes survive. Heating demand, fiscal year-end flows, harvest supply cycles — these are physical or institutional facts. They don't arbitrage away because a hedge fund read about them.
- Behavioural anomalies decay. The classic January Effect in small caps — driven by tax-loss selling and January reinvestment — has been fading for two decades. Once enough capital front-runs the crowd, the edge gets traded out of existence.
The difference between an edge and a coincidence
A real seasonal edge shifts probabilities by a few percentage points — it might tilt a 50/50 coin toss to 54/46. That's meaningful over hundreds of trades and worthless on any single one. If someone's selling you a seasonal pattern as a guaranteed direction — "gold always rallies in January" — they're not selling seasonality, they're selling certainty that doesn't exist in any market, calendar-based or not.
The honest way to use seasonal trading patterns is as one input among several: a nudge on bias, a reason to size slightly differently, never a standalone entry signal. Treat it the way you'd treat any other statistical edge — real, measurable, and still capable of losing on any given month.
The 2026 Verdict Table: Grading Every Famous Seasonal Pattern
Here's the direct answer: of the eight most-cited seasonal trading patterns, three still hold up as fact, three are fading with shrinking or unstable edges, and two have decayed into fiction that keeps getting repeated on trading forums without evidence behind it. Below is the grading breakdown, with sample size and historical hit rate for each.
| Pattern | Market | Window | Sample Size | Historical Hit Rate | 2026 Grade |
|---|---|---|---|---|---|
| Turn of the month effect | US equity indices | Last 1-2 sessions + first 3 of next month | ~50 years | ~65-70% | Fact |
| Gold January/August strength | XAUUSD | Jan and Aug | ~30-40 years | ~60-65% | Fact |
| Natural gas winter seasonality | NatGas futures | Nov-Jan | ~25-30 years | ~60% | Fact |
| Santa Claus Rally | S&P 500 | Last 5 + first 2 sessions of Jan | 7 sessions/year | ~57% (small sample) | Fading |
| Sell in May / Halloween indicator | US/global equities | May-Oct vs Nov-Apr | ~70 years | ~55-58% post-2000 | Fading |
| Crude's driving season | WTI | May-Sep | ~30 years | ~52-55% | Fading |
| January Effect (small caps) | Russell 2000 vs S&P 500 | First 2 weeks of Jan | ~90 years, decayed post-2000 | ~50% since 2000 | Fiction |
Fact: patterns that still show up in the data
The turn of the month effect is the tendency for equity indices to post outsized returns in the last one to two trading sessions of a calendar month and the first three of the next — a window that's produced a disproportionate share of total monthly returns for decades. It survives because it's structural, not psychological: pension contributions, 401(k) auto-investments, and payroll-linked buying all cluster into this window, and that plumbing hasn't changed. Gold's January and August strength holds for similar structural reasons — Indian wedding-season demand and Western institutional rebalancing both land in those months. Natural gas winter seasonality persists because heating demand is a physical, non-negotiable driver that no amount of arbitrage capital can erase.
Fading: patterns with shrinking edge or unstable samples
The Santa Claus Rally is only seven trading sessions — too small a sample to lean on with conviction, and recent years have delivered flat or negative readings that dent the historical hit rate. Sell in May and go away, the Halloween indicator's flip side, still shows a return gap between the two six-month halves, but the gap has compressed sharply since 2000 as algorithmic capital arbitrages the seasonality away. Crude's driving-season strength has weakened too, diluted by US shale flexibility that smooths out summer demand spikes that used to move price on a schedule.
Fiction: patterns you should stop trading
The January Effect — small caps outperforming large caps in early January on tax-loss-selling rebound — is the clearest fiction on this list. It was real when retail access to small caps was thin and tax-loss selling created genuine December liquidity gaps. Post-2000, ETF access flattened that friction, and tax-loss automation front-runs the rebound before retail traders can act on it. If you're still building seasonal trading strategies around this one, the data says stop.
Gold Seasonality: Why January and August Matter for XAUUSD
Gold seasonality is one of the few calendar patterns that survives contact with modern markets: XAUUSD has historically posted its strongest average returns in January and again from mid-August into September, driven by physical demand flows that don't care what a chart pattern says. Unlike the January Effect in small caps, gold January strength is anchored in real buying, not a tax-quirk that algorithms have since arbitraged away.
The demand calendar behind gold's seasonal legs
Two physical demand cycles put a genuine bid under gold at predictable points in the year. Indian wedding season and the run-up to Diwali (typically October-November) drive jewellery fabrication demand that builds through late summer — Indian and Chinese households historically account for a large share of global physical gold offtake. Ahead of Chinese New Year, jewellers and central bank-adjacent institutions restock inventory, and that restocking usually front-runs the holiday by six to eight weeks, landing squarely in January. Layer in Q4 fabrication demand for Western jewellery retail (holiday gifting), and you get two distinct windows — January and mid-August through September — where physical buyers are net accumulators rather than net sellers. This is the gold January strength and gold August rally traders reference, and it's the physical gold demand cycle underneath both legs.
Summer softness and the June-July trough
The flip side is the June-July trough — the gold summer doldrums. Indian wedding buying has typically wound down, Chinese New Year restocking is long spent, and Western investment desks are running reduced summer books with less appetite for fresh macro positioning. Physical demand thins at exactly the point where speculative flow would need to pick up the slack, and it usually doesn't. This is the seasonal low point for XAUUSD in a typical year — not a crash, just a genuine air pocket in demand.
How reliable is the gold seasonal window in practice
Be honest about the distribution here: "average January is positive" hides a wide spread of outcomes. Some Januaries rally hard, others chop sideways or dip before recovering, and a hawkish Fed repricing or a sudden dollar spike (check the Federal Reserve's rate decisions and the DXY) can override the calendar with zero warning. The seasonal edge is a tilt, not a signal you trade in isolation.
| Month | Typical XAUUSD tendency | Primary driver |
|---|---|---|
| January | Above-average, wide dispersion | Chinese New Year restocking |
| June-July | Below-average, "summer doldrums" | Thin physical + investment demand |
| Mid-Aug to Sept | Above-average | Indian wedding season, Q4 fabrication build |
Use this as a bias, not a trigger: in the seasonally strong windows, favor long setups on pullbacks and give breakout longs a bit more benefit of the doubt on your XAUUSD seasonal read; in the June-July trough, tighten your conviction on longs and let short-side or range setups carry more weight. The calendar tells you which side of the book to lean toward — your entry still has to earn its own risk-reward.
Index Seasonality: US100, S&P 500 and the Six-Month Effect
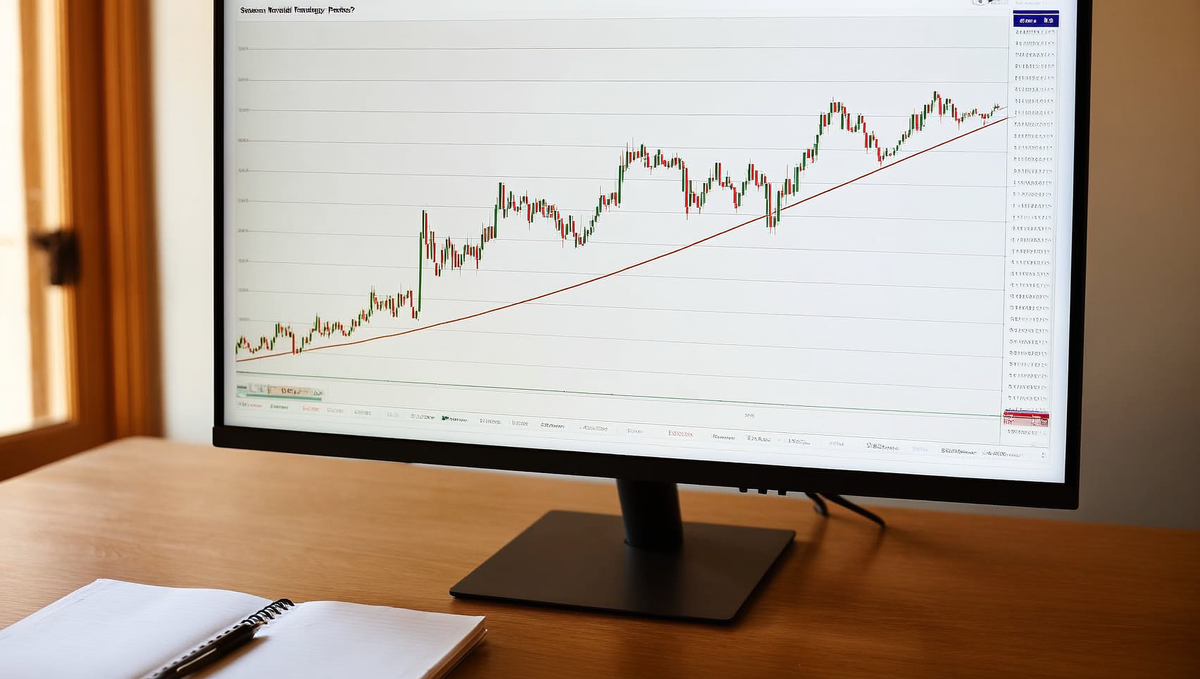
The Halloween effect is real in the data but weaker than the folklore: November-April has historically beaten May-October on the S&P 500 by a few percentage points a year on average, yet the gap has compressed hard since 2010 and simply staying invested has often outperformed the "sell in May and go away" rotation once you account for missed rallies during the supposedly weak half.
The November-April vs May-October split
"Sell in May and go away" is one of the oldest seasonal stock market patterns on record, and the underlying logic — thinner summer liquidity, institutional desks running lighter books, less fresh capital deployment until autumn — still holds some water. But the historical S&P 500 seasonality edge from this split has narrowed from a wide gap in the pre-2000 sample to something much closer to a coin flip over the last decade. A trader who went to cash every May and re-entered every November would have sat out several of the strongest summer rallies of the 2020s, including sharp AI-driven and rate-pivot-driven legs higher in the "weak" half. The pattern is a tilt, not a rule you trade mechanically.
Nasdaq's own seasonal profile and earnings clustering
US100 seasonality runs on a different clock than the broad S&P 500 because the index is concentrated in mega-cap tech, and tech has its own earnings rhythm. The Nasdaq seasonal profile tends to show strength around January guidance season as companies reset full-year forecasts, and two distinct volatility clusters around April and October earnings — when a handful of megacaps move the whole index on a single print. Late summer, particularly August into early September, has historically carried a volatility uptick as thinner holiday liquidity meets the first pre-earnings positioning of the quarter. If you trade US100 setups, the earnings calendar matters as much as the seasonal calendar — often more.
September: the one month with a genuinely negative skew
September effect isn't a myth traders tell each other around the campfire — it's the most consistently negative single month across a long sample of S&P 500 and broader developed-market data, spanning decades and multiple market regimes. Nobody has a fully clean explanation: quarter-end rebalancing, post-summer institutional repositioning, and the historical clustering of macro shocks (Fed meetings, fiscal-year-end selling) around this window all get blamed. It's the one calendar effect in this section that shows up with enough consistency to actually adjust size around, rather than just note and move on.
| Period | Historical tendency | Practical read for you |
|---|---|---|
| Nov–Apr | Historically stronger half, gap narrowing since 2010 | Mild long bias, not a reason to skip short setups |
| May–Oct | Historically weaker half, but strong recent-decade returns | Don't sit in cash — trade the setup, not the season |
| September | Most persistently negative single month | Trim size, favor defined-risk and short-side bias |
| Jan / Apr / Oct (US100) | Guidance and earnings-driven volatility spikes | Widen stops, expect gap risk around big-cap prints |
For a prop trader, the practical translation is narrow but useful: index seasonality should nudge your position sizing and setup selection — smaller size and tighter risk management heading into September, more patience for pullback longs across November-April — but it never tells you to sit out. The calendar adjusts how much risk you put behind an idea, not whether you show up to trade it.
Trading Seasonalities in the Futures Markets
Futures seasonality is a different animal from index seasonality, and it's more reliable in principle because it's anchored to something physical: a tank of natural gas, a barrel of crude, a bushel of corn in the ground. You're not trading a calendar quirk in fund flows — you're trading storage cycles, refinery schedules, and pollination weather. That structural anchor is exactly why futures seasonality rewards traders who study the underlying commodity, and punishes anyone backtesting a continuous chart without understanding how that chart was built.
Natural gas and the heating-season demand cycle
Natural gas winter seasonality is the cleanest physical story in commodities. From April through October, utilities inject gas into underground storage ahead of winter demand — prices typically soften or chop as inventory builds. From November through March, storage draws down to heat homes and run power plants, and any cold snap against a tight storage print can spike the front month hard. The pattern isn't superstition; it's the withdrawal season showing up in EIA storage reports every Thursday. The catch: a mild winter or a shale supply surge can override the seasonal tendency completely, so this is a bias to lean on, not a signal to trade blind.
WTI crude: driving season and refinery maintenance
Crude oil's summer driving season — roughly Memorial Day through Labor Day in the US — lifts gasoline demand and historically firms crack spreads and WTI itself. But the setup and unwind around that window matter more than the season itself: refiners run maintenance ("turnaround") in spring before driving season ramps up, and again in autumn before winter-grade fuel production, temporarily cutting crude demand and gasoline supply in ways that swing the WTI-RBOB relationship independent of the outright price trend.
Grains: planting, WASDE reports and harvest lows
Corn and soybean seasonality tracks the crop calendar, not the trading calendar. Prices price in weather risk from planting through pollination in July — the "weather market" window when a dry forecast in Iowa moves more than any technical level. Once the crop is made, cash grain floods the market at harvest and prices frequently bleed into harvest lows through September-October. Layered on top: the monthly WASDE report (World Agricultural Supply and Demand Estimates) resets the supply/demand picture and routinely produces the sharpest single-day moves of the month, seasonal bias or not.
Why contract rolls and contango break naive seasonal backtests
Here's the part almost nobody in retail content covers properly. Most seasonal backtests run on continuous back-adjusted charts — a single price series stitched together across CME futures roll dates as one contract expires and the next becomes the front month. That stitching is fine for spotting a chart pattern, but it quietly launders the roll yield into your "seasonal edge."
If a market sits in contango — deferred contracts priced above the front month, common in natural gas and crude during oversupply — a continuous chart rolled forward will bleed value every roll, manufacturing a fake downtrend that no trader ever actually captured, because you'd have been paying that spread on every roll, not collecting it. In backwardation — deferred months priced below front month, common in tight physical markets — the reverse happens: the continuous chart shows a seasonal uptrend inflated by roll yield, not by the calendar effect you think you're trading.
| Backtest method | What it captures | Risk |
|---|---|---|
| Continuous back-adjusted chart | Long-run trend/pattern visibility | Blends in roll yield from contango/backwardation as fake seasonality |
| Individual contract months | True price action for a specific delivery month, year over year | Shorter data history per contract, more noise |
| Roll-adjusted spread analysis | Isolates the calendar spread itself, strips out directional roll drift | Requires spread-aware platforms, steeper learning curve |
The fix is straightforward: test seasonality on individual contract months (the actual March natural gas contract, year after year) or on roll-adjusted spreads rather than a naive continuous series. Platforms like Seasonax and SpreadCharts are built specifically to handle CME futures roll dates and contango/backwardation correctly, which is why serious futures traders use them instead of eyeballing a generic continuous chart. If you're trading futures seasonality on a For Traders challenge, that distinction isn't academic — it's the difference between a backtested edge and a roll-yield mirage.
Holiday and Summer Liquidity: The Pattern That Never Died
This is the seasonal effect you don't need a 200-year dataset to trust: trading volume mechanically collapses around specific calendar dates, every single year, because the humans and algos that provide liquidity are literally not at their desks. Unlike statistical curiosities that decay once enough traders crowd them, holiday and summer liquidity gaps are structural — they show up whether or not anyone is trying to trade them.
Thanksgiving
US equity and equity-index volume can fall toward 70% of a normal session by the Wednesday before Thanksgiving, and Friday's half-day session often trades on a skeleton book. If you hold US100 or S&P-linked positions into that window, you're trading in a market where the same order size moves price further than it would on a regular Tuesday. Thanksgiving trading volume thinning isn't a rumor — it's visible on any volume histogram you pull up, and it bleeds into futures and FX pairs correlated with US risk sentiment too.
Christmas and the volume cliff
The stretch from December 24 through January 2 runs on skeleton desks across every major financial center. Christmas liquidity doesn't taper gently — it drops off a cliff, then snaps back just as abruptly once desks reopen in the new year. Gold, indices, and majors all see this, but it's most dangerous in instruments that already have wider natural spreads, because holiday spread widening compounds on top of an already-thin book.
August doldrums and European school holidays
Roughly the first three weeks of August, a huge chunk of European institutional desks are on holiday, and US desks quiet down too. This is the classic August summer doldrums window: early London-hours price action in August behaves nothing like early London hours in October. The same 8:00 London open that reliably produces a clean directional leg in autumn can chop sideways on fumes in August, then suddenly gap on a headline because there's no depth to absorb it.
| Period | Typical liquidity impact | Practical adjustment |
|---|---|---|
| Day before Thanksgiving | Volume toward ~70% of normal in US equities/indices | Cut size, widen slippage buffer |
| Dec 24 – Jan 2 | Skeleton desks, thin order books across asset classes | Avoid new breakout entries, tighten watchlist |
| Early-to-mid August | European/US institutional holidays, reduced session depth | Treat session opens as unreliable until volume returns |
| Post-holiday reopen | Volume snaps back, volatility can spike | Expect wider ranges, re-widen stops proportionally |
Trading thin markets: spreads, slippage and fake breakouts
Three practical rules keep thin-liquidity periods from eating your account:
- Widen expected slippage, don't ignore it. A fill that costs you 2 pips on a normal Tuesday can cost you 6-8 pips in the Christmas week — build that into your R:R before you enter, not after you get filled.
- Cut position size rather than stop distance. Tightening your stop to compensate for a wider spread just gets you stopped out by noise. Reduce lot size instead and keep your stop logic intact.
- Treat thin-volume breakouts as suspect. A level that breaks cleanly on August 5th with a quarter of normal volume behind it deserves confirmation from the next full session before you trust it. Fading illiquid moves is equally risky — with no depth on the book, price can run far past where the order flow "should" stop it.
Ready to trade funded capital?
Choose your path — Instant Accounts, One-Step or Two-Step Challenges — from just $23, with up to $300,000 in funded capital.
Choose your challengeThe Month-by-Month Seasonal Calendar for 2026
A seasonal trading calendar is only useful if you can see it collide with the macro calendar — because a "seasonal" entry stacked on an NFP CPI FOMC print isn't seasonality, it's an event trade wearing a costume. Below is the 2026 map across XAUUSD, US100 (Nasdaq) and S&P 500, plus the CME futures contracts that share the same institutional flows.
Q1: January Gold, Japanese Fiscal Year End, March Quad Witching
January has historically been gold's strongest single month — new-year allocation flows into safe-haven assets, reinforced by Lunar New Year physical demand out of Asia. Layer that against the first NFP Friday of the year and you get exaggerated moves that fade fast once the print is digested.
Late March brings the Japanese fiscal year end on 31 March. Japanese institutions and exporters repatriate offshore holdings back into yen ahead of book close, a flow that has historically pressured USD/JPY lower into month-end regardless of the interest-rate backdrop. It's one of the few seasonal patterns with a clean structural cause — not superstition, an actual balance-sheet deadline.
The third Friday of March is also quad witching — stock index futures, index options, stock options and single-stock futures all expire simultaneously. Volume and volatility spike into the close as funds roll and rebalance; US100 and S&P 500 often see erratic intraday swings that have nothing to do with fundamentals and everything to do with expiring contracts.
Q2 and Q3: Driving Season, Summer Thinning, September Risk
April through August is "driving season" for crude oil (CME's WTI contract) — US gasoline demand rises seasonally, and refiners bid up crack spreads ahead of the summer travel peak. June through August also brings the well-documented summer thinning across FX and equities: lower volume, wider spreads, more false breakouts. This is where the reduced-size, wait-for-confirmation approach from thin-liquidity sessions matters most.
September has the worst average seasonal return for the S&P 500 going back decades — and it's also loaded with FOMC, quarter-end rebalancing, and the return of full institutional volume after summer desks empty out. Don't assume September weakness is "just seasonality" — check whether the move you're seeing is riding a September FOMC decision instead.
Q4: Harvest Lows, Heating Season, Tax-Loss Selling and Window Dressing
Agricultural futures (corn, soybeans, wheat) often print harvest lows in September-October as physical supply floods the market post-harvest, then seasonally recover into year-end. Natural gas flips from injection to withdrawal season in November as US storage draws down for winter heating demand — this switch has historically been one of the more reliable calendar effects in the CME NYMEX complex.
December is dominated by two institutional flows working in opposite directions: tax-loss harvesting, where investors sell losing positions before year-end to realize losses against gains, pressures already-weak names lower into mid-December; then window dressing — fund managers buying winners and dumping losers before year-end statements go out — tends to lift the same broad indices into the final week. This is the mechanical backbone behind the "Santa Claus rally" narrative.
| Period | Asset | Seasonal Tendency | Macro Collision Risk |
|---|---|---|---|
| January | XAUUSD | New-year allocation strength | First NFP Friday |
| Late March | USD/JPY | Fiscal year-end repatriation, JPY strength | FOMC (if scheduled) |
| 3rd Fri Mar/Jun/Sep/Dec | US100, S&P 500 | Quad witching volatility spike | CPI mid-month proximity |
| Apr–Aug | WTI Crude | Driving season demand lift | OPEC+ headlines |
| Jun–Aug | FX majors, equities | Summer liquidity thinning | Low-volume false breakouts |
| September | S&P 500, US100 | Historically weakest month | September FOMC |
| Sep–Oct | Corn, Soybeans | Harvest lows | USDA reports |
| November | Natural Gas | Injection-to-withdrawal switch | Weather-driven volatility |
| Mid-Dec | Broad equities | Tax-loss harvesting pressure | December FOMC |
| Late Dec | S&P 500, US100 | Window dressing rally | Thin holiday liquidity |
How to Backtest a Seasonal Pattern Without Fooling Yourself
A seasonal pattern only earns a spot in your playbook if it survives a hostile backtest — most don't. Run the numbers properly and you'll find the majority of "reliable" seasonal setups posted in trading forums fall apart the moment you apply real statistical scrutiny. Here's how to tell the survivors from the noise.
Sample size: why 12 years is 12 data points
If you backtest "buy Gold on October 15, sell November 15" over 12 years, you don't have thousands of data points — you have 12. One seasonal window per year is one independent observation, no matter how many candles sit inside it. A 60% hit rate across 12 years means 7 wins and 5 losses. Flip a coin 12 times and you'll land on 7 heads a meaningful chunk of the time. That's not an edge, that's variance dressed up as a strategy. Sample size seasonality is the first filter, and it kills more "proven" patterns than any other single factor.
Multiple testing and the pattern you found by looking
Scan 12 calendar months across 40 markets and you've run 480 separate tests. At a standard 95% confidence threshold, roughly 24 of those will look statistically significant purely by chance — before you've found a single real edge. This is multiple testing bias, and it's the quiet reason so many seasonal patterns look incredible in a backtest and evaporate in live trading. If you scanned for it, assume it's noise until proven otherwise.
What a credible Sharpe and max drawdown look like
Real seasonal edges don't look like miracle equity curves. Quantpedia's published seasonality strategy research — a widely cited academic-style database — shows metrics like a 7.62% CAGR, 9.43% volatility, a 0.81 Sharpe ratio, and a -11.98% max drawdown. That's the honest shape of a genuine, published, non-hyped seasonal edge: modest, survivable, unglamorous. If a pattern someone's selling you claims a 3+ Sharpe with single-digit drawdown over a seasonal window, be skeptical — that's a red flag, not an edge.
| Acceptance Criteria | Why It Matters |
|---|---|
| 25+ years or observations | Enough independent samples to separate signal from coin-flip variance |
| Out-of-sample confirmation | Test on a later period you didn't use to find the pattern |
| Stable when window shifts ±3–5 days | Real effects don't evaporate if you move the entry date slightly |
| Plausible structural cause | Harvest cycles, FOMC calendar, fiscal year-end flows — not just "it worked" |
For the research itself, tools like Seasonax (built by Dimitri Speck) and SpreadCharts (developed by Pavel Hála) let you visualize decades of seasonal data and test window stability directly — both are built specifically for this kind of seasonal backtest work, and both make it easy to see whether your edge survives a shifted window before you risk simulated capital on it.
Trading a Seasonal Window Inside Prop Firm Rules
A seasonal bias tells you which direction to lean, not when to pull the trigger — you still need price structure to confirm the trade, and you still need to size it so one bad thesis doesn't wreck your evaluation. Prop firm risk rules don't care how many decades of data back your pattern. A daily loss limit breach on day three ends the account regardless of whether gold's January strength shows up on schedule three weeks later.
Confirmation first: never trade the calendar blindly
The window opening is not your entry signal. If the seasonal edge points long, you wait for the market to show you a pullback into a level, a break-and-retest of structure, or some other technical trigger before committing simulated capital. Buying the moment the calendar flips just because "this is historically the strong week" is how you end up entering on the worst possible tick, right before a shakeout. Treat the seasonal window as a filter that narrows your watchlist and sets your directional bias — the actual entry still comes from the chart, the same way it would on any other setup you'd take under your prop firm risk rules.
1.5× ATR stops and fractional risk sizing
Once structure confirms, place your stop roughly 1.5× ATR beyond the swing, not on the round number just below it. Round numbers get swept first — everyone's stop is sitting there, and market makers know it. ATR stop placement forces you to size the position around actual volatility instead of an arbitrary price level, which matters more in seasonal setups because the whole idea is holding through some chop while the pattern plays out.
Widen that ATR buffer during holiday sessions — the week around Christmas, early January, and other thin-liquidity stretches where spreads inflate and a normal-sized stop gets tagged on noise alone. Your position sizing should shrink as your stop distance grows, so risk per trade stays constant regardless of how wide the ATR buffer needs to be that week.
Protecting the daily loss limit and max drawdown
Size every seasonal trade so a full thesis failure costs a small slice of your daily loss limit — not most of it. Seasonal trades often need weeks to resolve, not hours, and that time horizon is exactly what makes them dangerous under evaluation rules built around daily and max drawdown limits. You can be completely right about the pattern and still get disqualified if one oversized entry blows through your daily cap before the thesis has time to work.
Two habits protect you here. First, never stack a seasonal entry directly on FOMC, NFP, or CPI release dates — let the volatility spike pass, then re-enter on confirmation, because a seasonal edge measured in weeks doesn't need you exposed to a five-minute data-driven whipsaw. Second, stagger entries across the window instead of committing full size on day one. Scaling in as confirmation builds keeps your average risk lower and means a false start doesn't consume the daily loss limit you need for the rest of the window to play out.
Ready to trade funded capital?
Choose your path — Instant Accounts, One-Step or Two-Step Challenges — from just $23, with up to $300,000 in funded capital.
Choose your challengeSeasonal Trading: Where It Helps and Where It Hurts
Pros
- Gives you a directional tilt and a reason to stand aside in historically hostile windows
- Futures seasonality is anchored in physical supply and demand, so it decays more slowly than behavioural equity anomalies
- Holiday and summer liquidity effects are mechanical and observable in real time, not just in backtests
- Pairs cleanly with technical confirmation as a filter rather than competing with it
- Encourages planning trades weeks ahead, which cuts impulsive screen-time decisions
Cons / risks
- Small samples — a 20-year window is 20 observations, easily mistaken for significance
- Continuous futures charts and contango can manufacture seasonal returns that were never tradeable
- Crowding has visibly decayed popular patterns such as the January Effect since 2000
- One macro shock, policy shift or geopolitical event overrides any calendar bias instantly
- Seasonal trades often need weeks to work, which sits awkwardly with daily loss limits and evaluation time pressure
Frequently Asked Questions
Are seasonal trading patterns real or just noise?+
Seasonal patterns are real in the sense that certain calendar-based tendencies show up repeatedly across decades of data, but many are weaker than the backtest screenshots suggest. Effects like reduced summer liquidity, year-end index rebalancing, or gold's demand cycle around Diwali and Chinese New Year have identifiable structural drivers, not just curve-fit coincidence. The problem is crowding and sample size — once a pattern gets popular, algorithmic participants front-run it and the edge decays. Treat seasonality as a bias that shifts probability slightly in your favor, never as a standalone signal you trade blind.
What is the seasonal profile of gold XAUUSD?+
Gold has historically shown strength in January (post-holiday physical demand rebuilding, portfolio rebalancing into safe havens) and again in late summer/August ahead of Indian wedding-season and festival buying that ramps into September-October. This isn't a guaranteed setup — it's a multi-decade tendency with a moderate hit rate, disrupted in years with strong dollar trends or unexpected rate moves. Since gold is the most-traded instrument on many prop platforms, traders lean on this seasonality as context for bias, then confirm with price action before sizing a trade around a Two-Step Challenge or Instant Funding account.
Does 'sell in May and go away' still work?+
The May-to-October weak-seasonality effect for equities has held up statistically over long samples, but the margin between summer and winter returns has narrowed since 2010 as more capital chases it systematically. It still correlates with genuinely thinner summer liquidity and lower realized volatility, which matters for spread costs and slippage even if you're not trading the calendar effect directly. Relying on it alone to go flat for six months ignores that some of the best trending moves (2020, 2022) happened inside the supposedly weak period.
How does seasonality differ in futures markets?+
Futures seasonality is driven by physical supply-demand cycles — harvest timing in grains, injection/withdrawal seasons in natural gas, driving season in crude — making it more mechanically grounded than equity calendar effects. The catch is contract rolls: a naive backtest that stitches continuous contracts without adjusting for contango or backwardation will show phantom seasonal profits that vanish once you account for roll yield and real fill prices. Any seasonal futures strategy needs to be tested on individual contract months, not a blended continuous series, before you trust the numbers.
How many years of data confirm a seasonal pattern?+
As a rule of thumb, you want at least 15-20 years of data with the pattern holding in 65-70% of those years before treating it as a real bias rather than noise. Fewer than 10 years leaves you vulnerable to a handful of outlier years driving the whole average — a single 2008 or 2020 can flatter or wreck a seasonal stat. Also check consistency of magnitude, not just win rate: a pattern that wins 80% of years but gets wiped out by one large loss isn't tradeable at real position size.
How do holidays and low liquidity affect seasonal trading?+
Thin holiday liquidity — Christmas week, summer school-holiday months, or ahead of long weekends — widens spreads, increases slippage, and produces choppier, less reliable price action than normal sessions. Many seasonal patterns are partly explained by this mechanical liquidity effect rather than any predictive edge: fewer participants means moves that would normally fade instead run further. Practically, this means tightening position size or standing aside during known low-liquidity windows, since a stop that would hold in normal conditions can get taken out by a single thin-volume spike.
How do you size a seasonal trade safely?+
Size a seasonal trade smaller than your normal setups — typically half to a third of standard risk — since you're trading a statistical tendency, not a confirmed technical or fundamental trigger. Keep the stop tied to structure or ATR, not the seasonal thesis itself, so a failed pattern gets cut early instead of eating into your daily loss limit or max drawdown. On a funded evaluation, this discipline matters more than the edge itself — one oversized seasonal bet gone wrong can end a challenge that months of solid trading built.
How do you practise seasonal strategies before going live?+
Run seasonal setups on simulated capital first, ideally across at least two or three different years of the same calendar window, before committing to a funded evaluation. This lets you see how the pattern actually behaves under different macro backdrops — a January effect during a rate-cutting cycle looks nothing like one during a hiking cycle. Platforms offering demo access alongside a Trading Challenge let you journal seasonal entries, track slippage, and confirm the edge survives real spreads before you risk challenge fees or a funded payout structure.
Written by
Marcel Hambálek
Senior Trader, For Traders
Marcel trades Futures and Forex day-trading setups on funded accounts and writes about the executional details most traders skip — order types, slippage, session timing, platform quirks on MT5 and NinjaTrader. Pragmatic, mechanics-first, no fluff.
Follow on LinkedInReady to trade funded capital?
Choose your path — Instant Accounts, One-Step or Two-Step Challenges — from just $49, with up to $300,000 in funded capital.
Choose your challengeTrade up to $300,000
Choose challenge