
Combining technical and fundamental analysis can help you make better trading decisions. Here's how it works:
- Technical Analysis: Focuses on price trends, patterns, and indicators like moving averages, RSI, and MACD to identify the best times to buy or sell.
- Fundamental Analysis: Examines a company's financial health, earnings, and broader economic data to determine its long-term value.
Why combine them?
Using both approaches allows you to pick strong assets (fundamentals) and time your trades effectively (technicals). For example, you might identify a stock with solid earnings growth and then wait for a breakout above resistance to enter a trade.
Key Steps:
- Use fundamental analysis to build a watchlist of quality stocks.
- Apply technical tools to refine entry and exit points.
- Align trades with specific goals, such as profit targets or drawdown limits.
- Track performance and adjust your strategy as needed.
This dual approach is particularly useful in simulated trading environments, where you can practice without risk.
Fundamental vs Technical Analysis: What's the Difference?
Understanding Technical and Fundamental Analysis Basics
Technical vs Fundamental Analysis: Key Differences and Time Frames
To effectively use technical and fundamental analysis together, you first need to grasp what each method brings to the table. Technical analysis operates on the idea that a stock's price reflects all available information. It focuses on supply and demand dynamics to predict short-term price movements, making it highly useful for timing trades.
In contrast, fundamental analysis digs deeper into a company’s value by examining its financial health, competitive position, and broader economic factors. This approach is essential for long-term strategies, offering insights into a company’s strengths and potential for growth. While technical analysis answers the question of when to trade, fundamental analysis clarifies what to trade and why it could be a worthwhile opportunity.
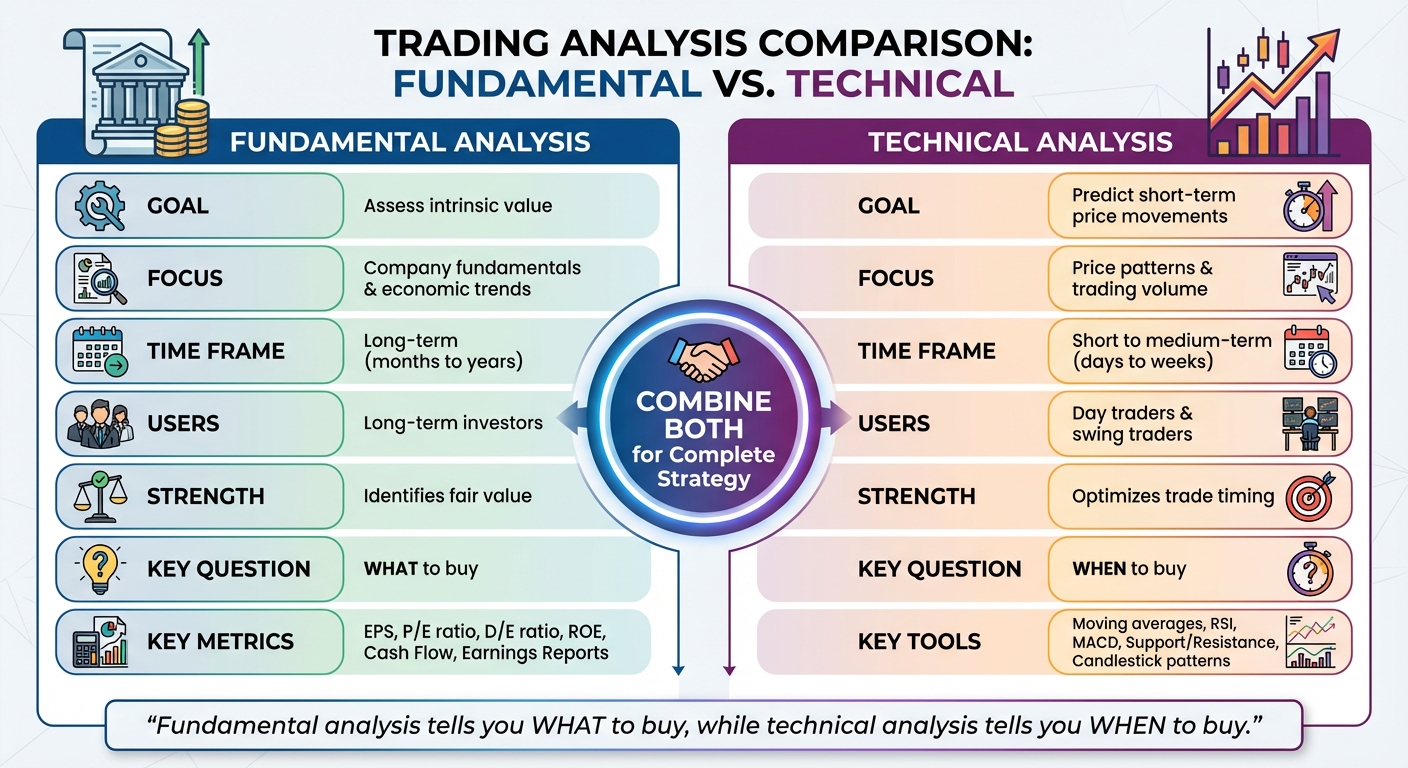
"Fundamental analysis tells you what to buy, while technical analysis tells you when to buy." - Gotrade Internal Analyst
The key difference between these methods lies in their time horizons. Technical analysis is typically used for short-term trades, spanning days or weeks, whereas fundamental analysis focuses on longer-term investments, often measured in months or years. Recognizing this distinction helps you align your approach with your investment goals - or better yet, combine both for a more complete market strategy.
Technical Tools for Short-Term and Swing Trading
Technical traders rely on a variety of tools to identify the best times to enter or exit a trade. Moving averages are a staple in this toolkit. For short-term trades, 15- or 21-day moving averages are common, while 50- or 200-day averages help spot longer-term trends. A stock moving above its moving average often signals the continuation of a trend. For example, if the closing price stays above a rising 15-day moving average, it’s typically seen as a bullish signal.
Oscillators and momentum indicators provide additional insights. The Relative Strength Index (RSI) is a popular tool, signaling overbought or oversold conditions when it crosses thresholds like 70 or 30. Other indicators, such as the Moving Average Convergence Divergence (MACD), Stochastic KD, and Larry Williams’ %R, help traders detect shifts in momentum.
Key price levels, like support and resistance, also play a crucial role. These points often indicate where strong buying or selling activity is likely. When combined with classic chart patterns - like those found in candlestick or line charts - they can help traders predict whether a trend will continue, reverse, or pause. Monitoring volume trends adds another layer of confirmation, as spikes in trading volume often signal increased interest in a stock.
Here’s a real-world example: In September 2024, a trader analyzed Nvidia stock, which showed strong fundamentals due to its role in the growing AI sector. The trader noticed the stock had approached a 50% Fibonacci retracement level near key support, with the RSI signaling an oversold condition. Using these technical signals, they entered a long position, placing a stop-loss just below the support level and setting a take-profit target at resistance.
Fundamental Metrics That Matter
Fundamental analysis evaluates a company’s financial performance and the broader economic landscape. Key metrics like Earnings Per Share (EPS) and earnings reports reveal profitability and financial health. Ratios such as Price-to-Earnings (P/E) help determine whether a stock is overvalued or undervalued, while Debt-to-Equity (D/E) and Return on Equity (ROE) provide insights into financial leverage and efficiency. Additional details, including cash flow, dividend history, and disclosures in 10-K reports, help paint a comprehensive picture of a company’s performance.
Broader economic factors also play a critical role. Decisions by the Federal Reserve on interest rates influence borrowing costs and consumer spending. Inflation, employment data, and other economic indicators further shape market conditions. Industry-specific trends - such as advancements in artificial intelligence or regulatory changes - can have a significant impact on a company’s outlook.
For traders in specific markets, unique variables come into play. For instance, weather patterns can drastically affect agricultural commodities, while inventory reports like the EIA’s weekly crude oil data are crucial for energy markets. Similarly, the housing sector often reacts strongly to shifts in interest rates and sales trends.
How Time Frames Differ Between the Two Methods
The time frame you’re working with often determines which method to prioritize. Technical analysis suits short-term trading, where timing is critical. Fundamental analysis, on the other hand, is better for long-term investments, where understanding a company’s value is key. Many seasoned investors use a combination of both - starting with fundamental analysis to identify promising stocks, then applying technical analysis to time their trades effectively.
| Aspect | Fundamental Analysis | Technical Analysis |
|---|---|---|
| Goal | Assess intrinsic value | Predict short-term price movements |
| Focus | Company fundamentals and economic trends | Price patterns and trading volume |
| Time Frame | Long-term (months to years) | Short to medium-term (days to weeks) |
| Users | Long-term investors | Day traders and swing traders |
| Strength | Identifies fair value | Optimizes trade timing |
For example, in September 2024, a trader anticipated a rise in gold prices ahead of a Federal Open Market Committee meeting. A dovish tone from the Federal Reserve suggested potential dollar depreciation, providing a fundamental cue. At the same time, gold prices broke out of a descending wedge pattern - an important technical signal. Combining these insights, the trader successfully positioned for a rally in gold.
How to Combine Both Approaches Step by Step
If you're looking to blend fundamental and technical analysis, it's easier than you might think. You don’t need fancy tools or complex systems to make it work. Start by using fundamental research to spot promising opportunities, then use technical tools to fine-tune your timing and manage risk. This method is especially useful in simulated trading environments, where you can test various strategies without risking real money.
Build a Watchlist with Fundamental Analysis
The first step is to screen for assets where the estimated intrinsic value is higher than the current market price. This helps you zero in on potentially undervalued securities. Look for companies with solid financial metrics, like strong earnings growth or healthy balance sheets.
Time Your Trades with Technical Analysis
Once you’ve identified fundamentally strong assets, use technical analysis to decide when to enter or exit. For instance, confirm your fundamental thesis by observing price action - like a breakout above key resistance levels or a moving average crossover (e.g., a 15- or 21-day moving average). Volume trends can also provide useful clues. A spike in trading volume during a breakout signals strong market interest, while declining volume during a rally might suggest weakening momentum. Protect your trades by placing stop-loss orders below support levels to guard against reversals, and set profit targets at resistance zones to lock in gains. Pair these entry and exit strategies with position sizing rules to meet simulated trading requirements.
Align Trades with Simulated Challenge Rules
After timing your entries and exits, structure your trades to meet the specific rules of simulated challenges. For example, For Traders' simulated challenges often include a 5% drawdown limit and a 9% profit target. To stay within these limits, calculate your position size so that your stop-loss doesn’t surpass the allowable drawdown. Test your strategy on historical data to ensure it performs well before applying it in a simulation. Develop clear, objective rules for your approach, including which indicators to use, the conditions for entering and exiting trades, and how to size positions. Be cautious about using too many indicators from the same category, as this can lead to redundant signals. Finally, keep a trading journal to track your progress, refine your methods, and figure out which combination of fundamental and technical analysis suits your style best.
sbb-itb-9de3b6e
Methods for Combining Technical and Fundamental Signals
Blending technical and fundamental signals can transform raw data into actionable trading insights. These strategies not only validate your trading ideas but also help minimize the chances of false signals. Let’s dive into practical ways to merge these two approaches effectively.
Confirm Fundamental Themes with Trend Indicators
When you spot a fundamentally strong company - think rising earnings, solid financials, or exposure to a booming sector - use trend indicators to confirm the timing of your trade. As heygotrade.com explains, "Fundamental analysis tells you what to buy, while technical analysis tells you when to buy".
Take Nvidia as an example from October 2025. A trader identified its strength based on surging earnings and dominance in the AI sector. Rather than jumping in immediately, they waited for a bullish crossover in Nvidia’s 50-day moving average before entering the trade. This combination of fundamental confidence and technical confirmation added precision to their decision-making.
For long positions, ensure the stock price stays above its 20-day moving average, with the 20-day also above the 50-day moving average - this setup indicates a solid uptrend. On the flip side, if the price drops below the 20-day moving average and the 20-day slips below the 50-day, it’s a clear signal of a downtrend.
Match Support and Resistance Levels with Fundamental Data
Support and resistance levels gain more weight when they align with key fundamental events. For instance, when a stock breaks through resistance or falls below support, check if the move coincides with relevant news like strong earnings, analyst upgrades, or impactful economic data. High trading volume accompanying such news often signals a more sustainable price movement.
Consider May 2025, when crude oil prices broke out of a technical pattern. A deeper look into the U.S. Energy Information Administration’s (EIA) weekly inventory report revealed declining inventory levels, which backed the breakout. This alignment of technical and fundamental factors led to a smarter trading decision. During volatile periods, be ready to adapt as the dynamics between support and resistance can shift quickly.
Use Volatility Indicators Around News Events
Big news events often cause sudden price swings, disrupting even the best setups. Volatility indicators like Average True Range (ATR) or Bollinger Bands can help you manage these situations by gauging potential market movement and adjusting your risk.
Take September 2024, for example. A trader focused on the Federal Open Market Committee (FOMC) meeting while trading gold. If the Federal Reserve maintained interest rates with a dovish tone, the dollar would likely weaken. If gold simultaneously broke out of its descending wedge pattern, the technical signal would suggest a rally.
Using ATR, the trader could widen stop-loss limits to account for increased volatility. Alternatively, they might wait for Bollinger Bands to contract, signaling reduced volatility, before entering a trade. This approach is particularly useful in simulated trading challenges, like those offered by For Traders, where managing drawdowns within a 5% limit is crucial. These tools refine setups, especially in high-pressure trading environments.
Managing Risk and Tracking Performance in Simulated Trading
Even the best strategies can fail without proper risk management. In simulated trading environments like For Traders' challenges - where a 5% maximum drawdown limit applies - every choice carries weight. Success hinges on structuring risk controls that align with both technical and fundamental analysis while consistently monitoring and improving your trading strategy. This disciplined approach ties seamlessly into the analysis techniques discussed earlier, creating a well-rounded trading plan.
Set Risk Controls Using Both Analysis Types
Combine technical and fundamental analysis to set clear stop-loss and take-profit levels. For instance, you could place stop-loss orders just below critical support levels while setting take-profit targets at resistance points for fundamentally strong assets. This method ensures losses are minimized while allowing profitable trades to reach their potential. Think of it this way: fundamental analysis identifies what to trade, while technical analysis determines when and how to manage risk. Focus on a handful of reliable indicators to simplify decision-making and ensure your strategy remains effective. These risk management tactics are particularly important for staying within the limits of simulated trading challenges like those offered by For Traders.
Adjust for News and Event-Driven Volatility
Major news events can throw even the most carefully planned setups into disarray. To navigate this, consider reducing your position sizes, widening stop-losses, or stepping back entirely during high-impact events like Federal Reserve announcements, earnings reports, or significant economic data releases. Keeping an eye on broader economic factors - such as interest rates, inflation trends, or GDP growth - can also help you anticipate potential volatility. For trading during events like FOMC meetings or earnings calls, tools like volatility indicators (e.g., ATR) or statistical models can help you better manage sudden risk shifts.
Track and Measure Your Performance
Documenting your trades in a journal is a critical step in improving your strategy. Record the rationale behind each trade and its outcome, and track metrics such as total return, trade count, Sharpe ratio, maximum drawdown, and CAGR. Simulated trading offers a risk-free environment to test and refine your approach based on real data. The goal isn’t to achieve perfection but to build consistency and continuously improve your trading plan. Systematic performance tracking, much like the earlier-discussed analysis methods, is a cornerstone of mastering a combined technical and fundamental strategy.
Conclusion
Blending technical and fundamental analysis offers a powerful way to identify strong stocks based on financial stability while also fine-tuning the timing for buying and selling. This combined strategy helps avoid the pitfalls of chasing price trends or investing in stocks with weak fundamentals.
By integrating these approaches, investors and traders can improve timing, reduce risk, and make smarter decisions regardless of market conditions. As Kotak Securities explains, "By combining both approaches, traders and investors can make more informed decisions and develop a well-rounded trading strategy". Fundamental analysis can help pinpoint quality stocks, while technical signals provide clarity on when to enter or exit positions, ultimately lowering risk.
This method is particularly effective in simulated trading environments. Platforms like Traders' simulated challenges offer a safe space to test this approach. With features such as a 5% maximum drawdown limit and customizable trading rules, you can experiment with various technical indicators and fundamental metrics to find what suits your trading style. For example, you can evaluate how moving averages align with earnings reports or how support levels respond to macroeconomic shifts, all while monitoring your performance in real time.
To get started, create a watchlist of quality stocks using fundamental analysis. Then, apply technical tools like moving average crossovers or support levels to time your trades. Use volume analysis for confirmation and adjust for broader economic trends. By merging these analysis methods and maintaining disciplined risk management, you can sharpen both your strategy and execution. This approach equips you to capitalize on opportunities in both short- and long-term trading, while honing your skills within the structured framework of simulated trading.
FAQs
How do I build a stock watchlist using fundamental analysis?
To create a well-rounded watchlist, start by pinpointing stocks with strong financial health. Look for companies that show consistent earnings growth, rising revenue, and manageable debt. Prioritize businesses with reliable models and a clear edge over competitors.
After narrowing down your options, turn to technical analysis tools. Indicators like moving averages, the Relative Strength Index (RSI), or volume trends can help you track price patterns and spot the best times to buy or sell. To further refine your strategy, factor in broader economic influences, such as interest rate changes or GDP trends, to ensure your trades align with the overall market environment. Combining these steps creates a balanced and informed approach to trading.
What are the most important technical indicators to help time your trades?
Some of the most commonly used technical tools for timing trades are moving averages, the Relative Strength Index (RSI), and the Moving Average Convergence Divergence (MACD). These indicators are designed to help traders spot trends, gauge momentum, and pinpoint potential entry or exit opportunities.
- Moving averages simplify price data by smoothing it out, making trends easier to spot. A key signal occurs when a short-term moving average crosses above or below a long-term one, potentially indicating a trend reversal.
- The RSI evaluates the speed and magnitude of price changes, helping traders identify whether an asset might be overbought or oversold.
- The MACD combines two moving averages to highlight trend direction and momentum shifts, often used to validate buy or sell signals.
When paired with fundamental factors like earnings reports or economic updates, these tools can provide a more comprehensive approach to making trading decisions.
What’s the best way to manage risk when combining technical and fundamental analysis?
To manage risk effectively while combining technical and fundamental analysis, begin by setting clear stop-loss orders for every trade. This helps cap potential losses and protects your investment. A good rule of thumb is to limit your risk to no more than 2% of your total account balance per trade, ensuring your capital stays safeguarded over time.
Another key strategy is diversification. Spread your investments across various assets or sectors to minimize the impact of any single market event. By doing so, you can navigate unexpected market swings with greater stability and maintain a more balanced trading approach.